
Published on 15 July 2018
random data analysis and visualization :)


I recently ‘re-watched’ movie Forrest Gump. Tom Hanks’ acting was magical. There is scene in the movie where he starts running whole day and roams around the city. It got me thinking about such random running. If I were to do something like that what different areas can I visit around my institute?
I immediately fired up my Google Maps app and started fiddling around. One way to answer this question is to check how far I can go from the origin (my institute) in different time steps. Crudest thing I can do is to assume some average walking speed and draw a circle around my institute with radius equal to my speed into time. However, this will not be correct measurement as I am not going to be walking in straight line. Walking route will have multiple turns and dead ends. Actual distance covered will depend on an exact tracing of the route. Hence, I decided to test this with some program where I can trace all possible routes around my origin.
I have previously played around with Google Map API as well as Google Earth Engine. These two are very feature-rich and used by millions of researchers across the globe. Somehow, I was not able to do such analysis with this API. Then I stumbled upon OSMnx library on github. This simple library was developed by Geoff Boeing of UC Berkeley. This library uses Open Street Map API along with rTree and Geopandas to construct simple functions. I was excited to see these simple functions doing some crazy analysis. Setting up this library on Windows in conda environment was very tricky. After frustrating 3 hours of internet search and downgrading few dependencies, finally it started working and I am ready to go.
First, I checked what is an average walking speed of human. I found out that average speed of men is 5.72+/-0.69 km/h while that of women is 5.54+/-0.64 km/h 1. This speed was for an adult who walks for an exercise. I assume casual walking speed will be slower. Also to make calculations simpler, I used 5 km/h. I decided to use time points as 10, 20, 30 and 60 min. Now plan was to download map of desired place and 4.5 km 2 around it. Then I will try to trace all possible combinations of locations where one can reach in given time period. Fortunately, OSMnx does all the magic for me. You can check out how it performs this analysis at their blog post. You can check my simple python script to perform this analysis.
First, I checked how far can I go walking from NCBS.
 |
|---|
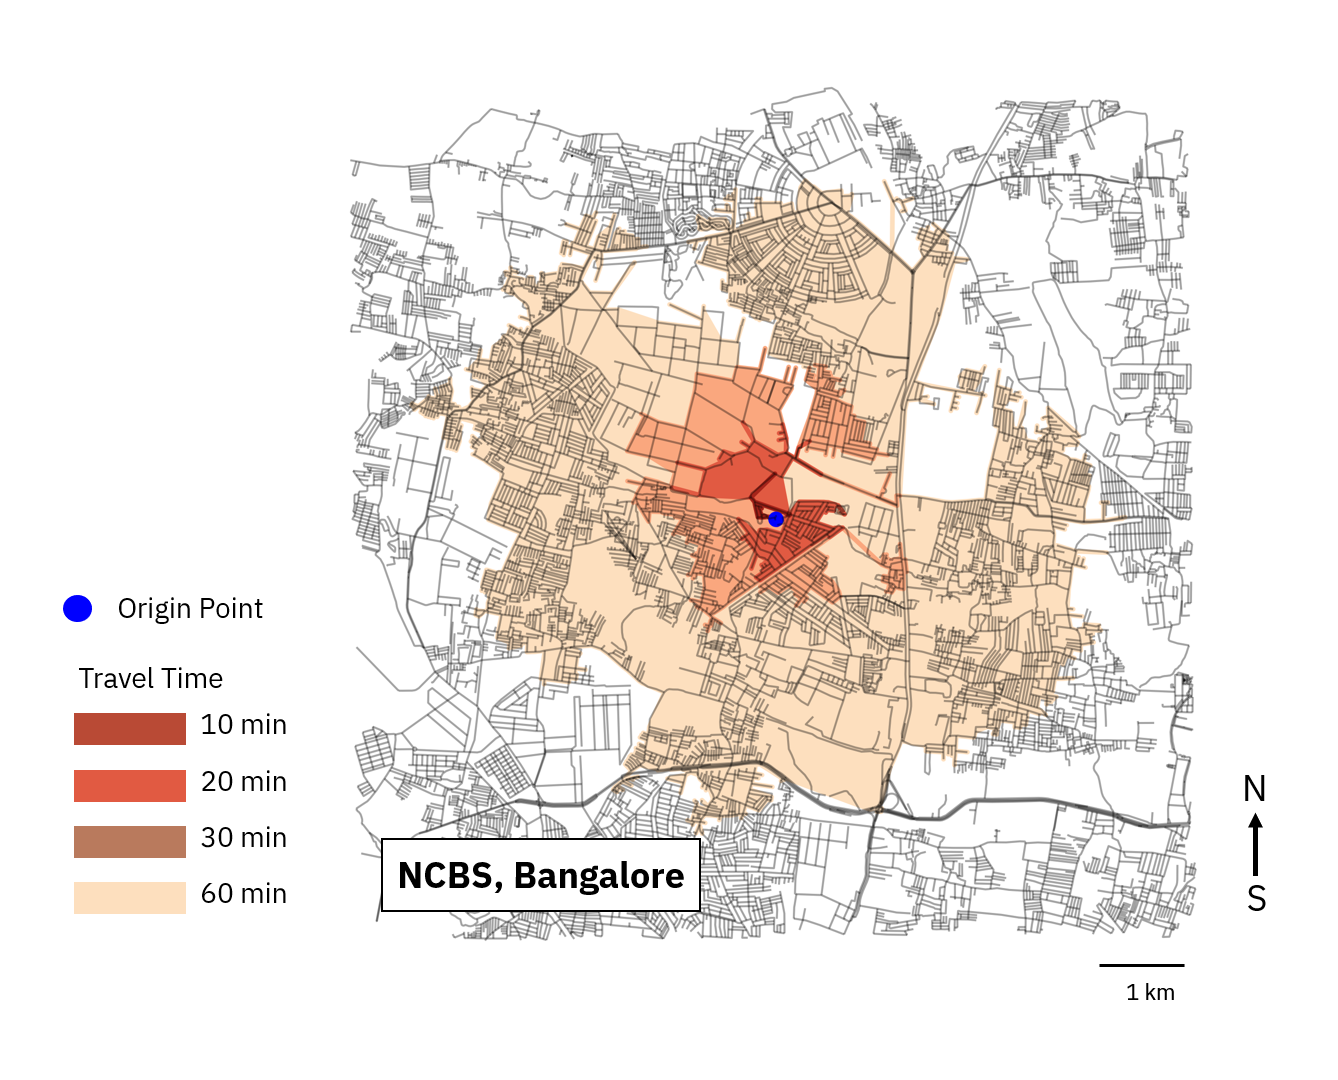
| Fig 1: Farthest distance one can reach by walking from NCBS with any possible route 4. Only walking routes are considered in this analysis. We are assuming constant speed through out our walk. Different color represents different travel time with lighter representing farthest area. |
To validate if this analysis is providing good enough information, I cross checked few areas around NCBS which I have personaly visited and timed. As seen in Fig 1, towards South, I can reach Sahakara Nagar in 20 min. Towards North-West, I can reach Tindlu Circle in 30 min. Towards East, I can hit Bellary road in 30 min. These all timings are more or less accurate!
Now we can use such map to check if institute is well connected to rest of the city. In this simplest analysis we will assume farthest distance one was travel is direct proxy for well connection to the city 3. I will add only representative institutes. I have tried to include institute area which has some kind of variation. You can check out your own by using python script from here.
 |
|---|
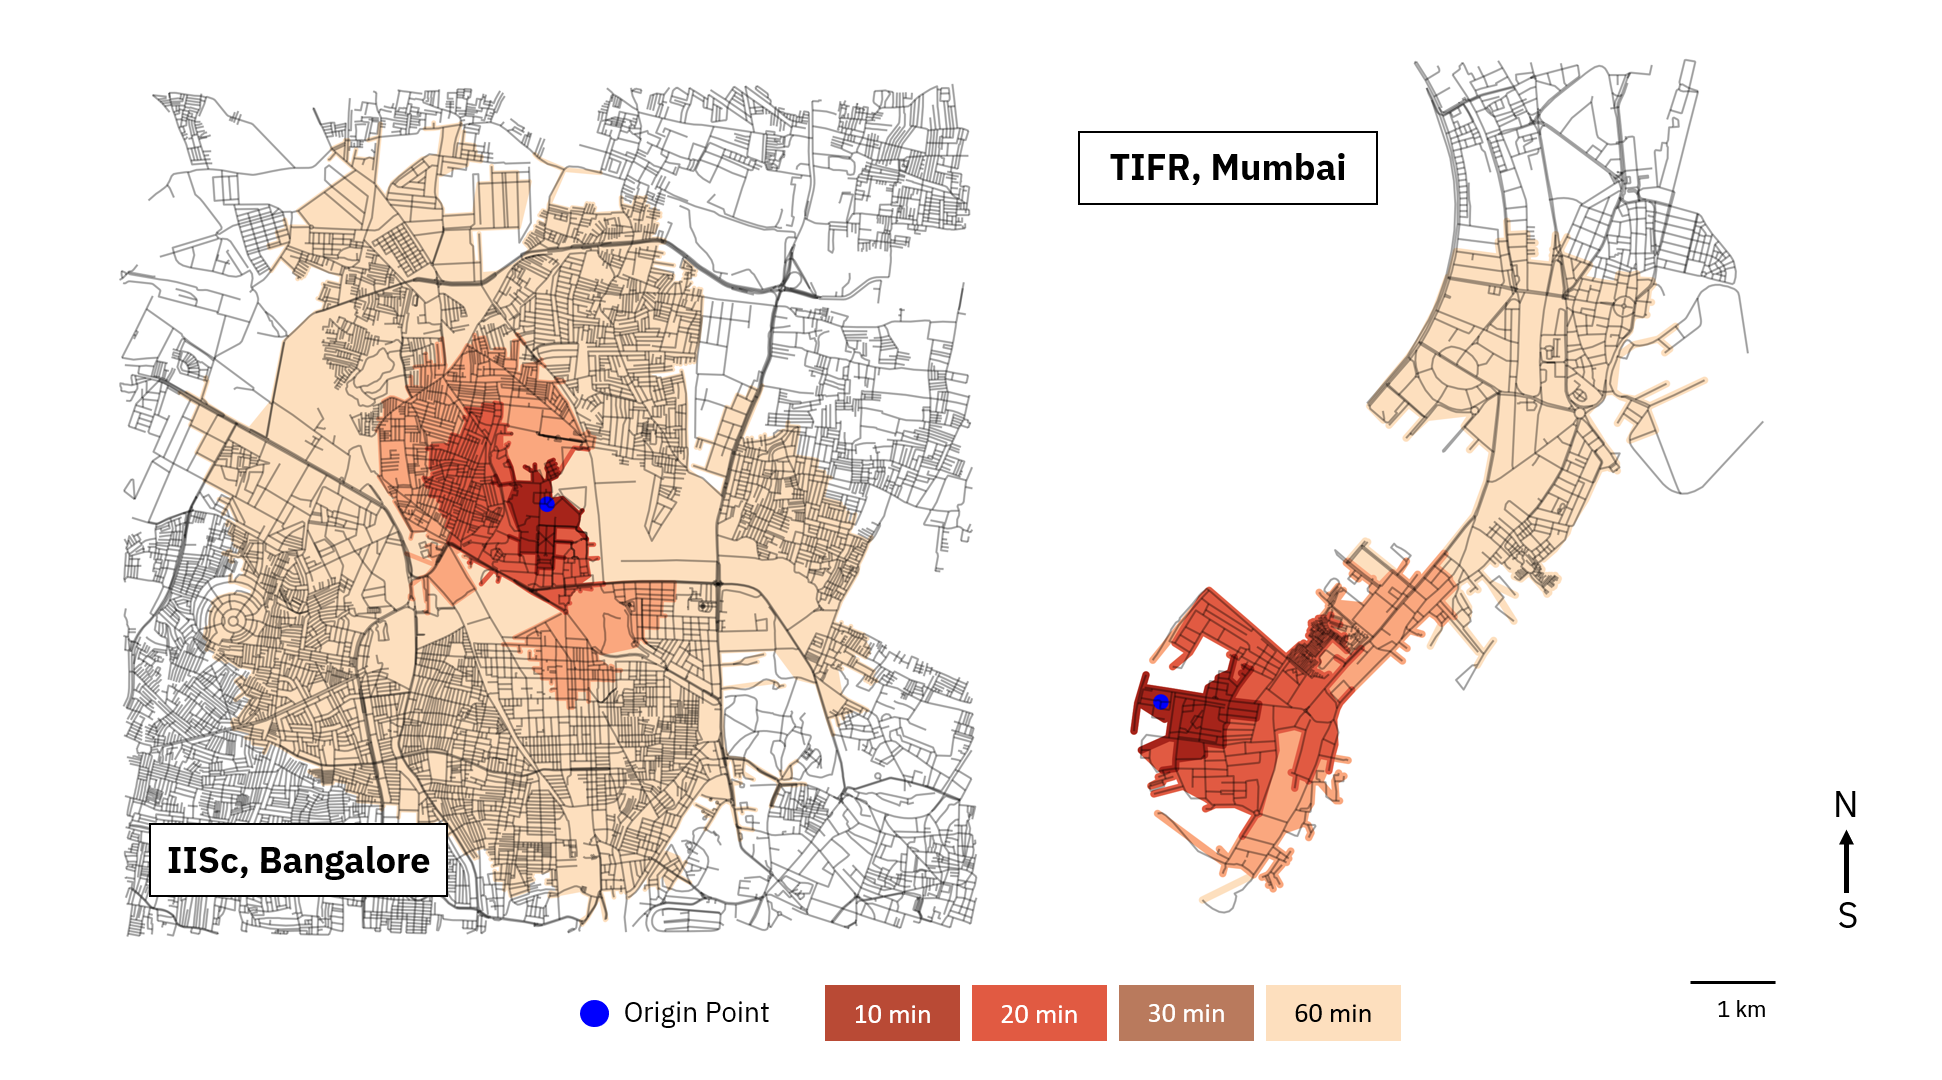
| Fig 2: Farthest walking distance from IISc and TIFR 4. Here blank area around TIFR is the Arabian Sea. Because of highly interconnected roads around IISc, we can see symetrical spread of farthest areas. |
 |
|---|
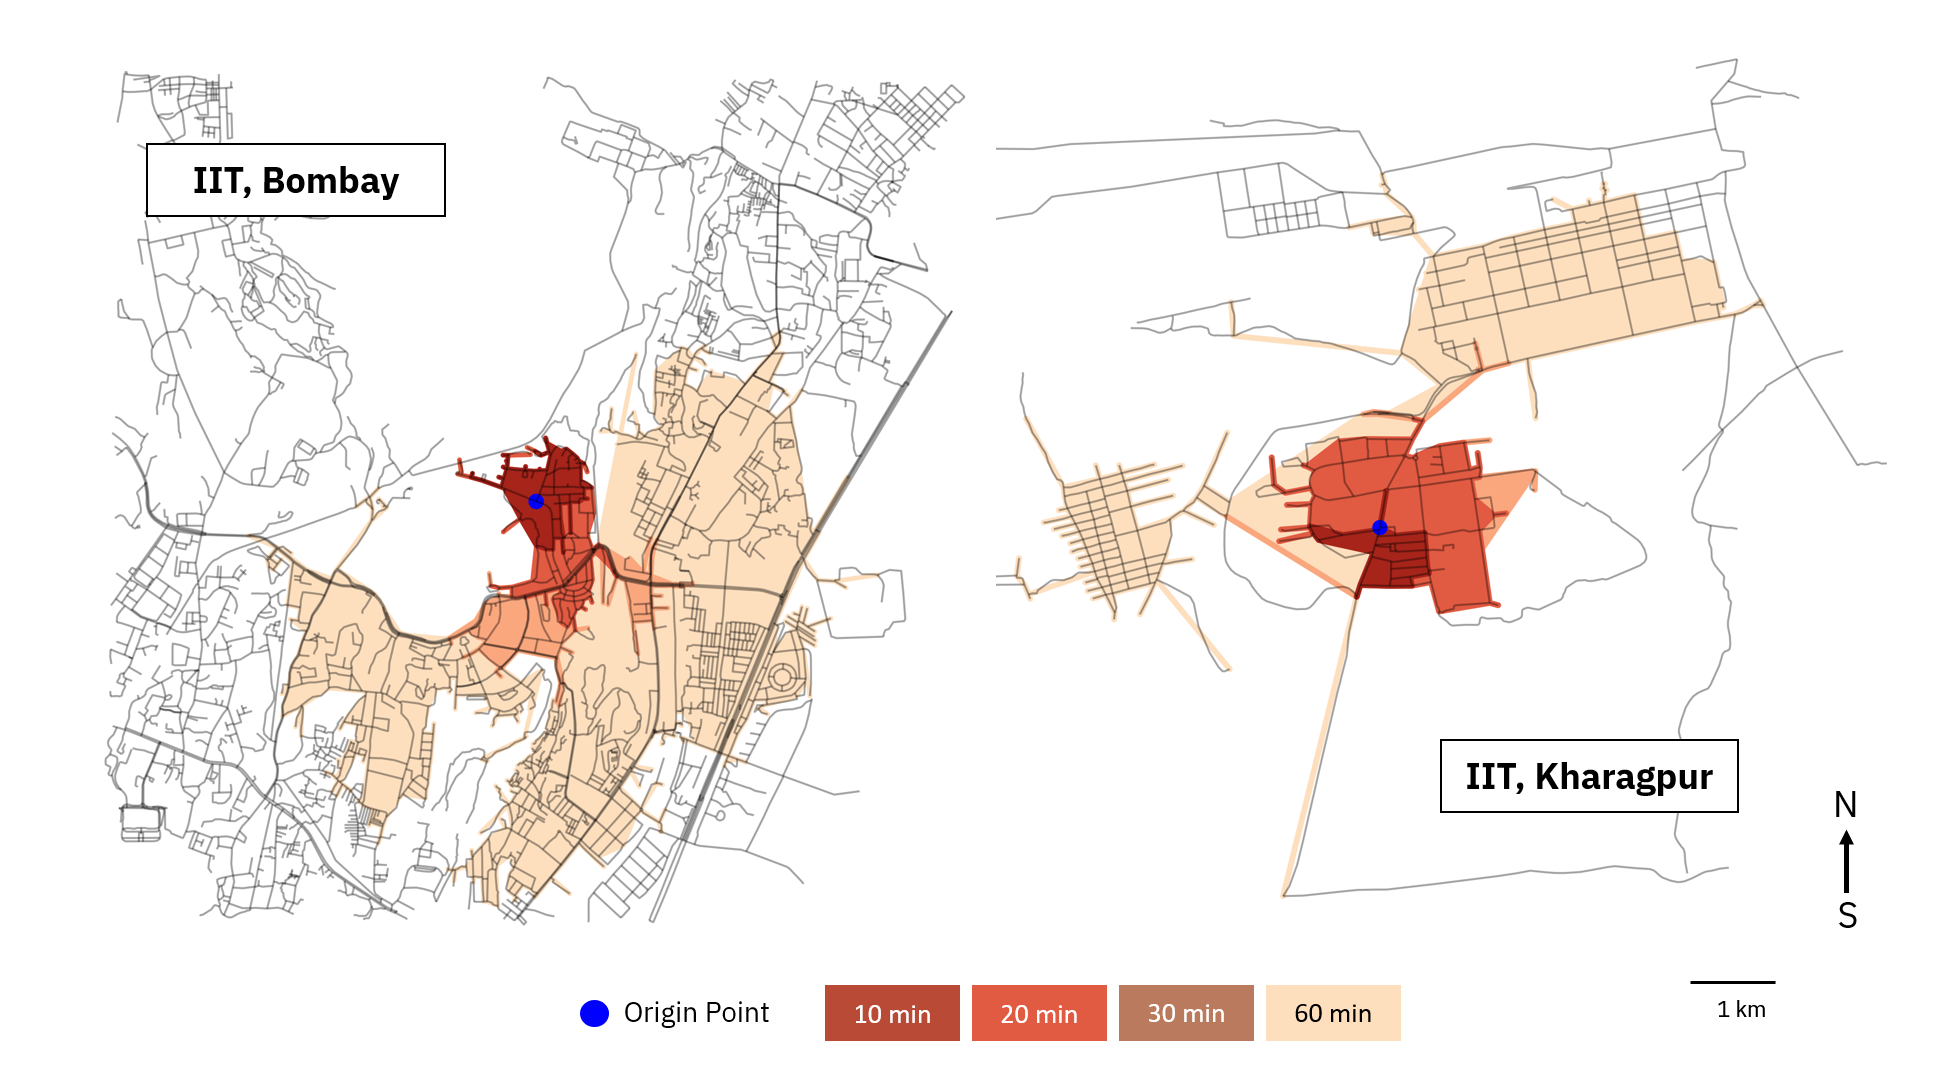
| Fig 3: Farthest walking distance from IIT Bombay and IIT Kharagpur 4. |
 |
|---|
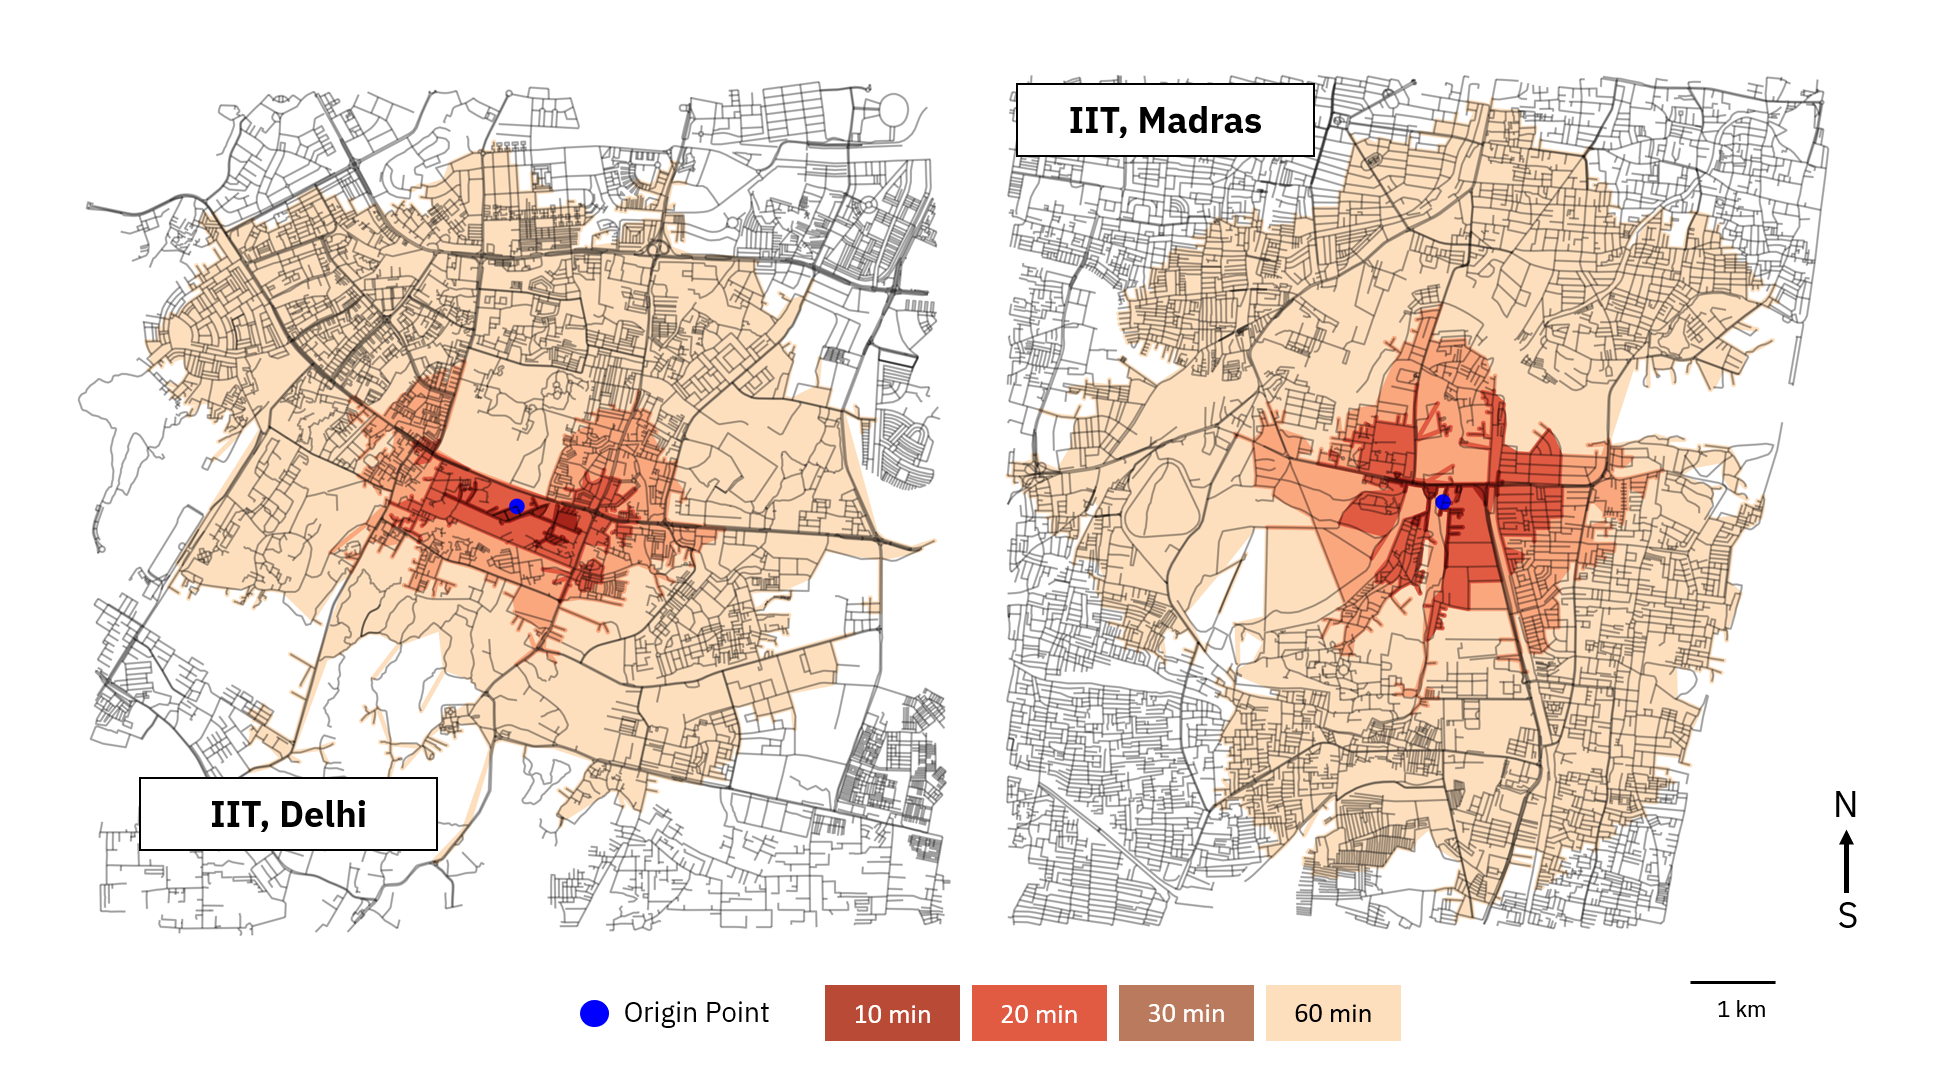
| Fig 4: Farthest walking distance from IIT Delhi and IIT Madras 4 |
Code used in the above analysis can be found here.
(Header image is downloaded from Pixabay.com under CC0-license)