

Published on 25 July 2018
random data analysis and visualization :)


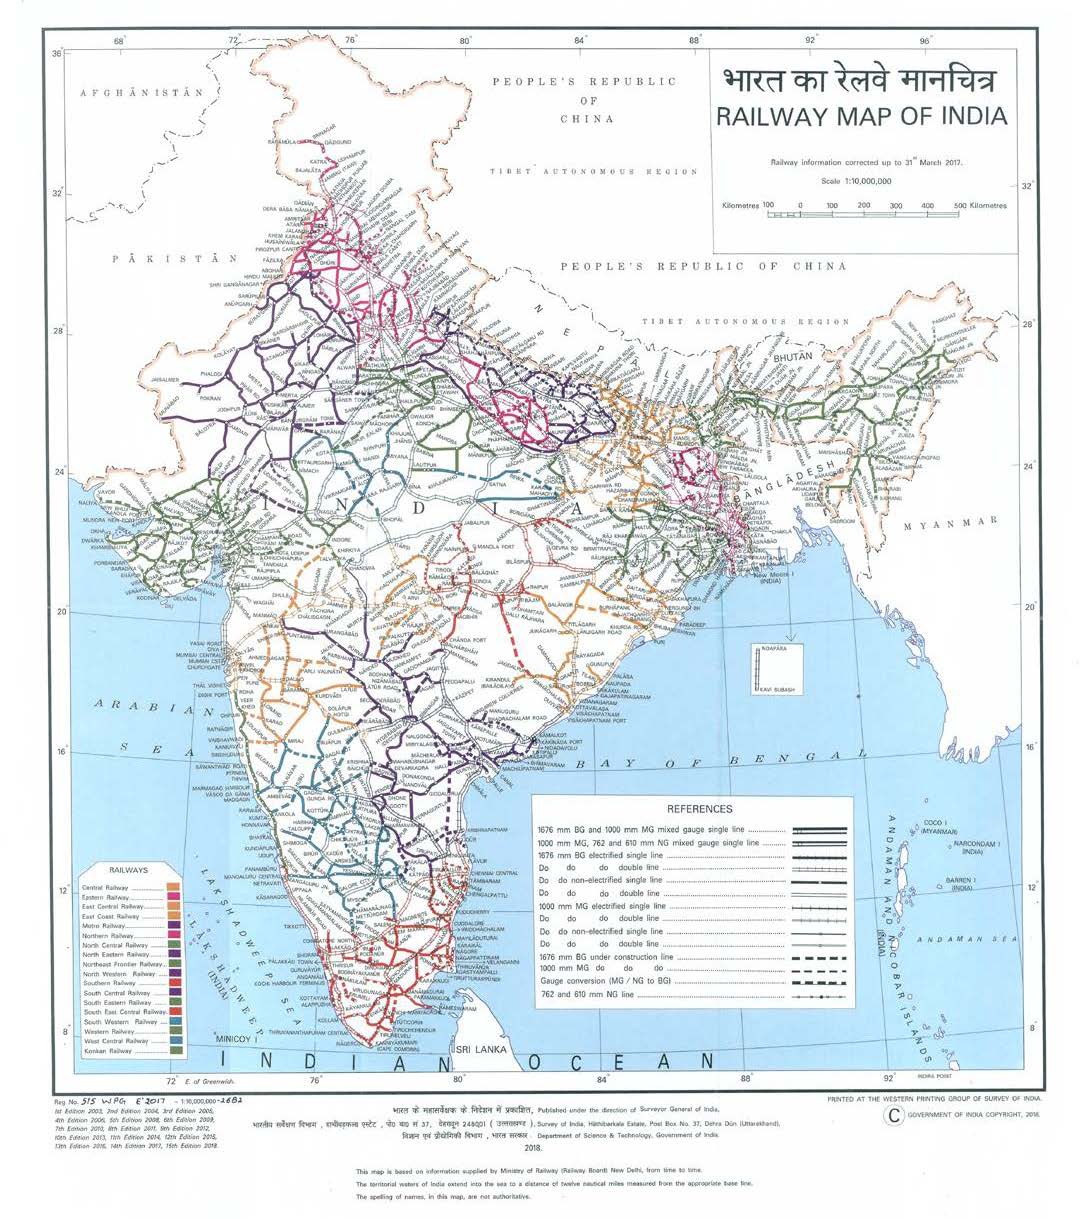
Indian Railways is the largest railway network by passenger transport 1 while 4th largest by total track route 2. This system is a backbone of long-distance Indian transport providing affordable commute to a commoner. Fig 1 shows an overview of the complicated network of railway tracks spanning all over India. To get a clear idea and appreciate this tremendous structure I decided to dig deeper. In addition, this makes it a very interesting data-set for applying some of the data-science and visualization techniques.
 |
|---|
| Fig 1: Railway Map of India 2. It is 4th largest railway network in the world by total track route1. |
As expected there were plenty of data-sets in a context of Indian Railways. However, most of them required me to use some web scrapping or their own API with some restrictions. Also, I wanted to get some credible source. Most of the data sets were outdated, I was not able to get any data set for the current year. Finally, I found official source 3 in Open Government Data (OGD) Platform of India. This has information about Indian Railways Time Table for trains available for reservation as on 1 Nov 2017. This was good enough start and I was happy about it. This data was lacking geographical information regarding railway stations. For visualization, information regarding the geography of railway stations was crucial. To obtain this information, I had to use selenium along with geckodriver. You can get all the code used in this analysis from RailwayVisualization repository. Please check respective code blocks for details about how this information was extracted. The code is heavily commented for readability.
To understand spread of our data, I checked some general statistics. Please note, all the analysis presented below is done on the data obtained from official website 3 while geographical information is scrapped from thrid party 4 website Indiarailinfo.com.
| Description | Value |
|---|---|
| Number of entries in the database | 186125 |
| Number of unique trains | 11114 |
| Number of origin stations | 928 |
| Number of station | 8155 |
| Total distance covered | 3878092 Km |
Here, origin station represents a total number of railway stations which are source station for one or more trains. The total number of trains also include local trains. Total distance covered is the summation of all the distances covered by each train from its source to destination. Every train is counted as only once.
Total distance covered is 3878092 Km. This is a huge number. This is 9.5 times larger than distance between the Earth and the Moon 5 and 96.8 times larger than the Earth’s circumference 6. Even if we assume every train runs only once in a week (which is obviously not true), Indian railways will cover on the average total distance of 554013.14 Km/day (still greater than the distance between the Earth and the Moon 5)
Above statistic was amusing but did not give any idea about how this network is distributed across India. As India is very geographically diverse, I was expecting to see this diversity reflected in the railway network. To access this, the only information I had in the current database was station names. I decided to check how the Indian railway looks from every station’s perspective.
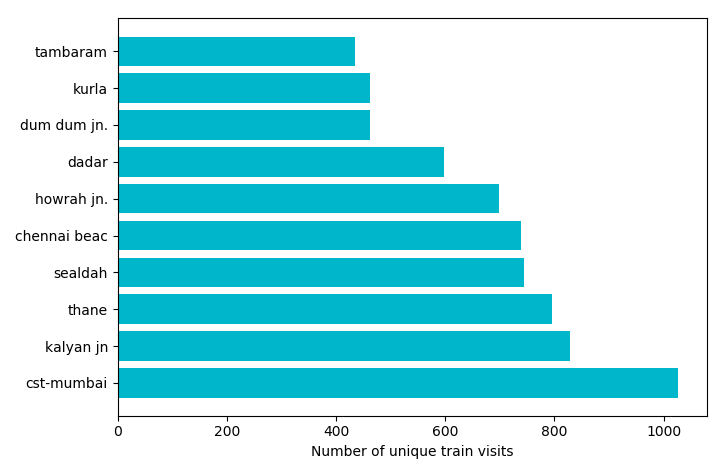
I checked which railway station9 is visited by a maximum number of unique trains (distinct train numbers). In this analysis, each train and its stops are counted.
 |
|---|
| Fig 2: The top 10 railway stations which are visited by most number of unique trains. |
Fig 2 shows the top 10 stations which are visited by the most number of unique trains. I think this plot is a little bit biased because of local and suburban train stations. Stations represented in this figure hosts local trains along with another kind. Nonetheless, these stations are visited by the most number of unique trains. I was not able to get hold of all local, suburban and metro train data. To remove this bias I decided to remove all short distance train from this list.
 |
|---|
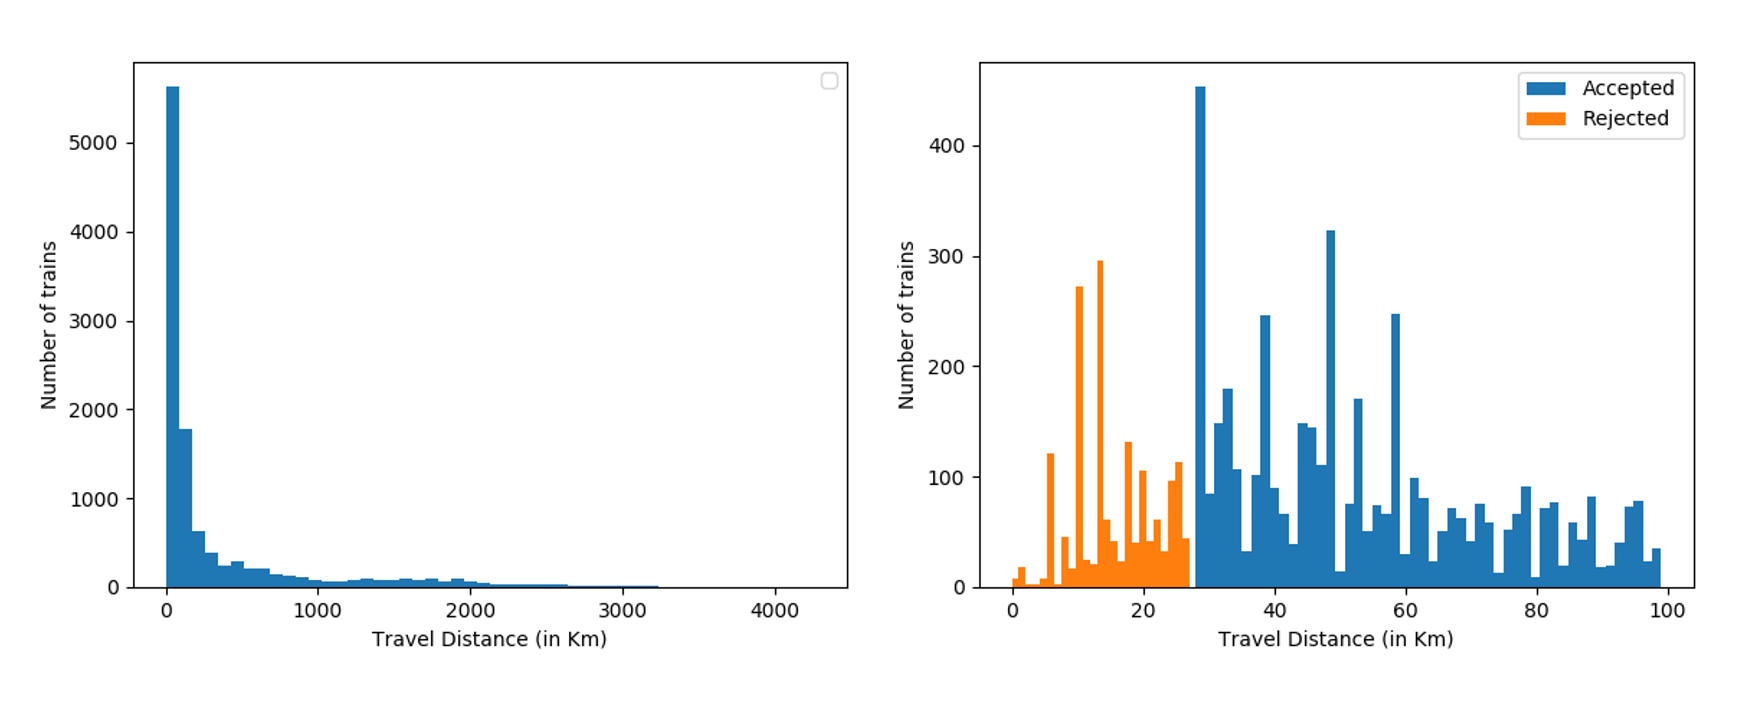
| Fig 3: Over all distribution of travel distances of all trains. To remove bias from local and suburban trains, we decided to use train with travel distance more than 27.71 Km (Bin size 8: 50). |
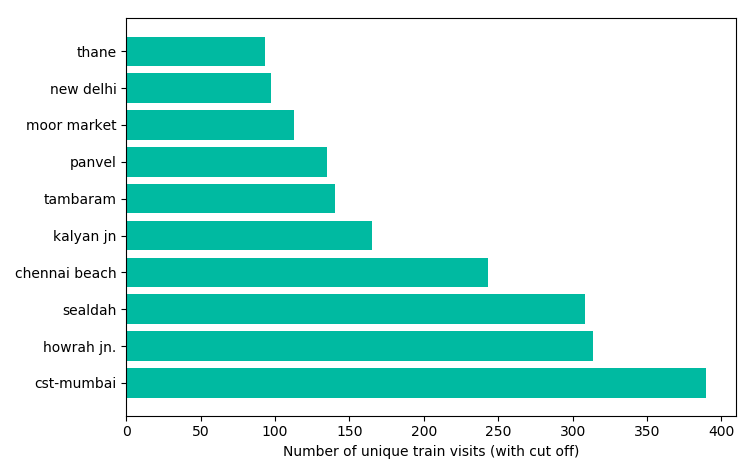
This was a little tricky and crude analysis. As you can see in Fig 3, there was no clear division between short distance versus long-distance trains. Hence I decided to use Mumbai 7 to calculate the diameter of the city which I can use as a cut off to remove short distance trains. I used 27.71 Km as a distance cut off to remove short distance trains.
 |
|---|
| Fig 4: Top 10 railway stations which are visited by most number of unique trains. Only train routes more than 27.71 Km are counted in this calculations. |
Fig 4 shows the new top 10 list after removing short distance trains. There is very little change in top stations. I am a little bit confident about this result because you can see ‘Dum Dum Jn.’ (which is the suburban railway junction ), ‘Dadar’ (on western line), ‘Kurla’ (on central line) was removed from the top list while ‘Panvel’ (connects local to Indian Rail on Harbour line), ‘New Delhi’ (Indian capital) and ‘Moor Market’ (Chennai Central) was added to the list. However, we need actual local/suburban train data for the precise list.
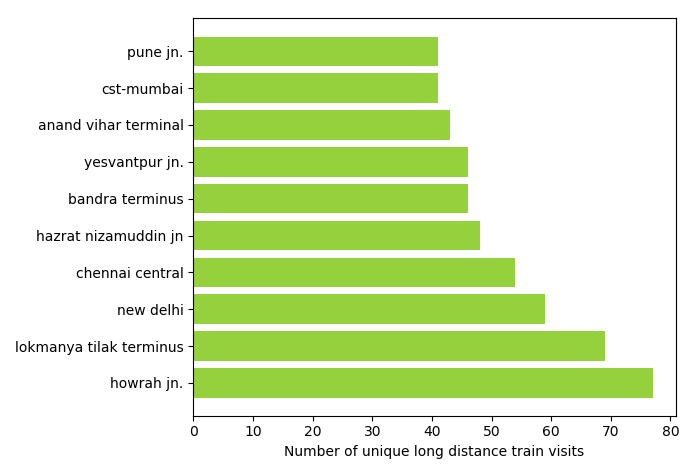
Just for the sake of curiosity I also checked top stations by putting cut off of 500 km which will tell you regional or zonal hubs for such long-distance trains.
 |
|---|
| Fig 5: Top 10 railway stations which are visited by most number of long distance trains. Only train routes more than 500 Km are counted in this calculations. |
 |
|---|
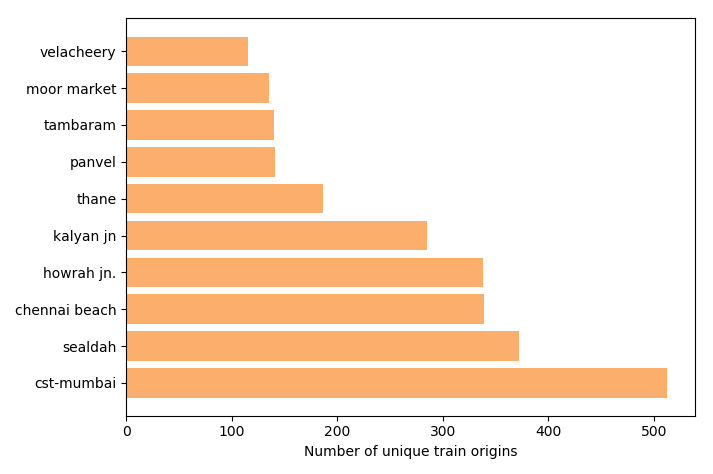
| Fig 6: Top 10 railway stations where most number of trains originates. |
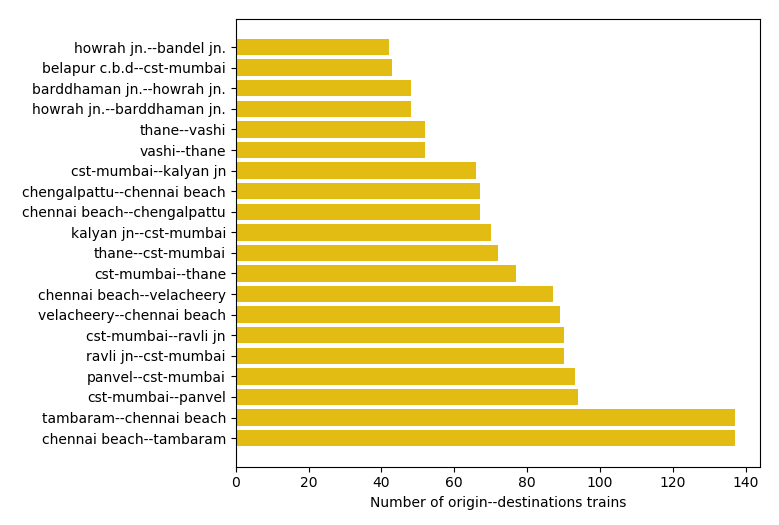
I think Fig 6 also has a similar bias to what we discussed in the previous section. However, we can see these are almost the same stations which we examined previously. I also checked same statistics for destination and it gave me the same plot. Suggesting there are generally opposite direction trains between stations. To test this hypothesis I checked top station pairs which act as origin and destinations.
 |
|---|
| Fig 7: Top railway origin-destination pairs which has most number of trains in between them. |
My theory was correct! There was indeed a pair of stations where an equal number of trains runs from both sides. However, this is just top 10 station pairs. This pattern might change as we look at more station pairs.
Since I had all station data-set, I checked following statistics,
| Most number of train stops | Value |
|---|---|
| 53041 Howrah - Jaynagar Passenger (Howrah-Jaynagar) | 118 |
| 13007 U Abhatoofan Express (Howrah-Shri Ganganagar ) | 112 |
| 13049 Amritsar Express (Howrah-Amritsar ) | 111 |
| Longest routes | Value |
|---|---|
| 15905 Dbrg Vivek Express (Kanyakumari-Dibrugarh) | 4260 Km |
| 15906 Vivek Express (Dibrugarh-Kanyakumari) | 4256 km |
| 2515 Guwahati Express (Trivandrum-Guwahati ) | 3939 km |
| Shortest routes | Value |
|---|---|
| 79485/79487/79489 Vijapur Ambliyasan Railbus (Vijapur-Ambliyasan) | 1 Km |
| 79486/79488/79490 Ambliyasan Vijapur Railbus (Ambliyasan-Vijapur) | 1 km |
| Highest distance per station | Value |
|---|---|
| 12214 Yesvantpur AC Duronto Express (Delhi-Yesvantpur) | 391.83 Km/station |
| 9006 New Delhi - Mumbai Central AC SF Special (Delhi-Mumbai) | 344.0 Km/station |
| 9005 Mumbai Central - New Delhi AC SF Special (Mumbai-Delhi) | 343.25/station |
In the next part, I will concentrate on state wise and zone wise distributions and related visualization!
Code used in the above analysis can be found here.
(Header image is downloaded from Pixabay.com under CC0-license)