

Published on 12 March 2019
random data analysis and visualization :)


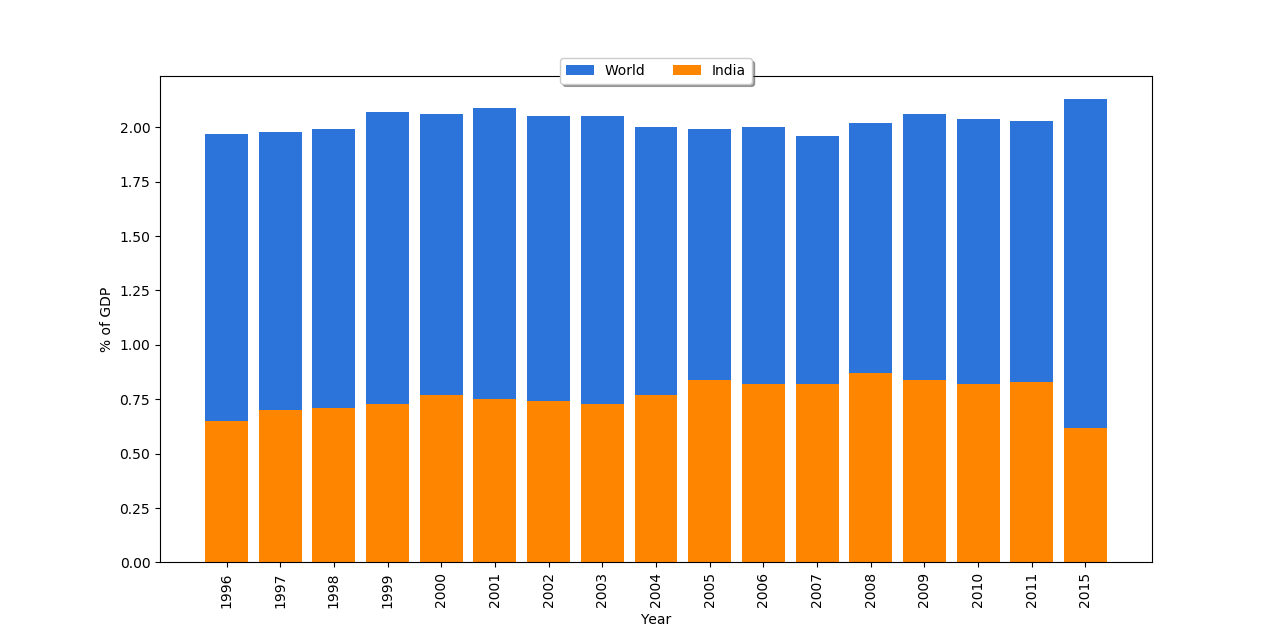
A few days ago, India celebrated its National Science Day which marks the scientific achievement of Sir C. V. Raman and also inspires many Indians to pursue science. In 1996, government budget for research and development was 0.65% of GDP while same was decreased to 0.65% of GDP in 2015 1. For year 2018-19, even after financial boost, it was around 0.8% of GDP 2. Government is trying to boost research by providing incentives like a financial reward for the publication. Although such schemes have received mixed responses from the Indian scientific community 4, 5, there is no proper data regarding scientific advances in India. Hence I decided to check it by myself.
 |
|---|
| Fig 1: Research and Development expenditure of India 1, 3. |
There are multiple factors like budget allocation, research infrastructure, external funding etc which can give you an idea about the scientific environment of the country. I decided to look at most simple factor i.e. peer-reviewed publication records. Another reason to look at this factor is due to the availability and quality of data. The best place to look at such dataset is PubMed. I decided to look at only PubMed indexed publications 6. The first hurdle I faced while retrieving this data was to filter it based on publications from a specific country. Unfortunately, such filter or meta-data was not available at PubMed. One of the ways to overcome this problem was to retrieve affiliations from all the authors and check the affiliation of the corresponding author. However, it will need a huge amount of storage space, internet bandwidth and computational power. As I had previously worked with such PubMed database, I know there is a further problem in getting proper affiliations and corresponding author details. Finally, I used a shortcut which will be enough to get an idea about my question. I decided to use PubMed advance search with affiliation qualifier. For this analysis, I used the following search query
india[ad]
Then I exported all the results in .csv format (send to > file > CSV) for further analysis. Few limitations of this approach are listed below
Nonetheless, I decided to use this as a preliminary analysis for understanding the original question. This dataset will at least provide us trends 7. All the code used in this analysis can be found on GitHub repository.
In this dataset, there are total 421990 papers from 7332 distinct journals. Oldest 8 available paper which has Indian affiliation was from 1793 by Boag W in Medical Facts and Observations !! Just on the side note, I got curious and looked at the oldest PubMed entry. It is from 1 Jan 1781 from The London medical journal. I checked which were journals where Indian researchers have published the most between 11 March 2019 to 1793.
| Journal Name | Number of paper |
|---|---|
| J Clin Diagn Res. | 6646 |
| PLoS One. | 4198 |
| Indian Pediatr. | 3807 |
| Indian J Exp Biol. | 3676 |
Next obvious step was to check information about the publication rate of Indian researchers.
 |
|---|
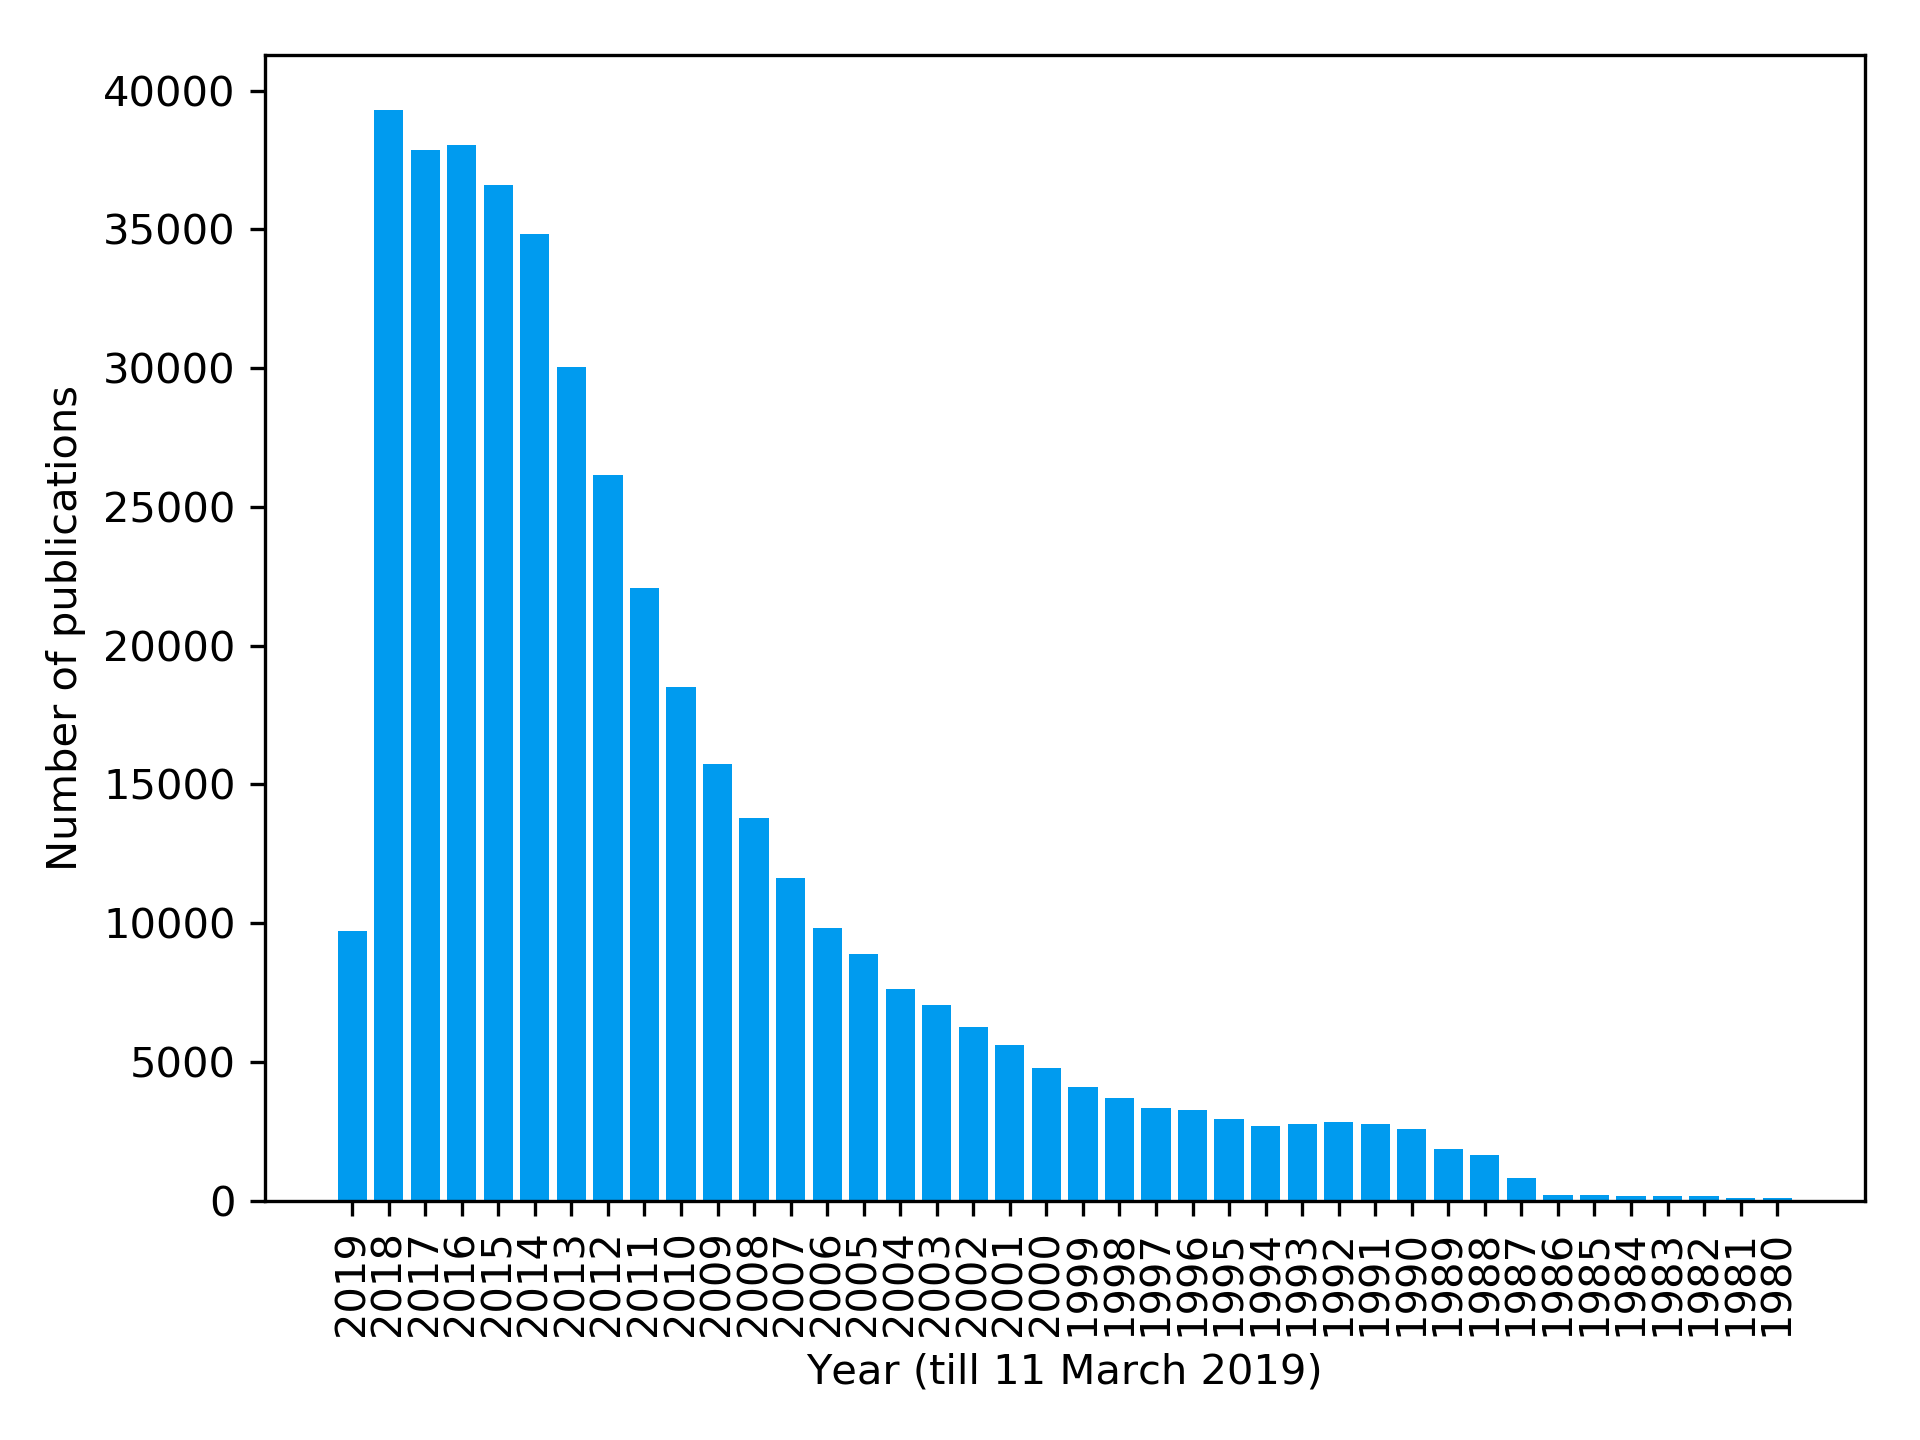
| Fig 2: Year wise publications of Indian Researchers. There was a long tail to this distribution till 1793 which is not shown here for visual clarity. |
There were 39300 papers published in 2018. If we calculate the rate of publications in the last 10 years (2008-2018) it is 31293.6 publications/year which is 375.9 % increase compare to 1998-2008 (8325.3 publications/year). Even if the publication rate is very high, we should check where are these paper published.
 |
|---|
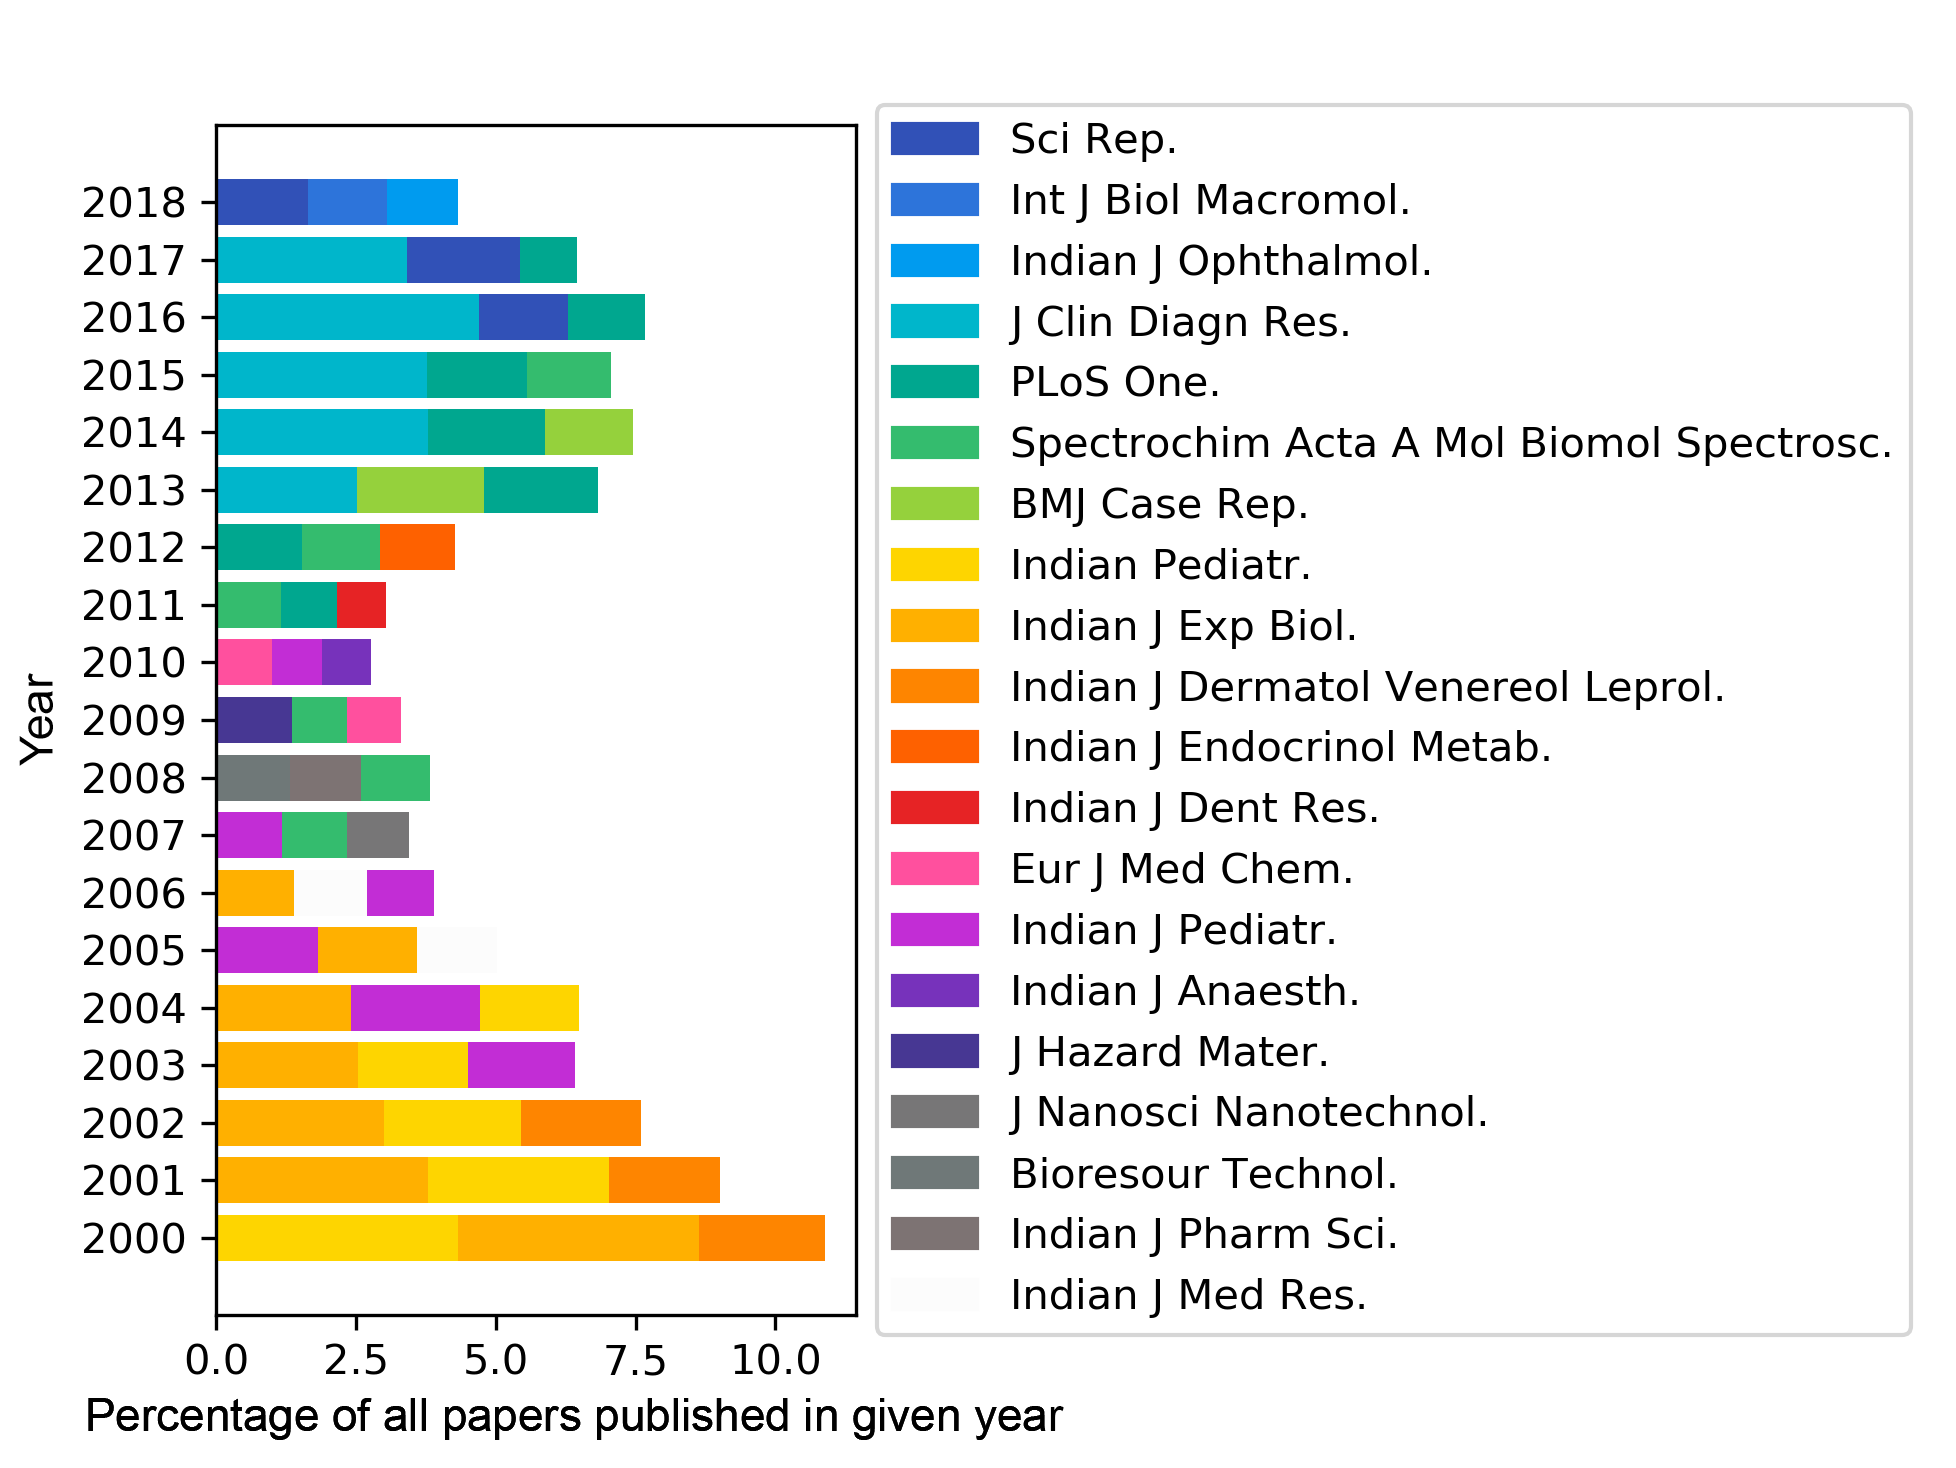
| Fig 3: Top 3 journals where Indian researchers published the most in given year (2000-2018). |
 |
|---|
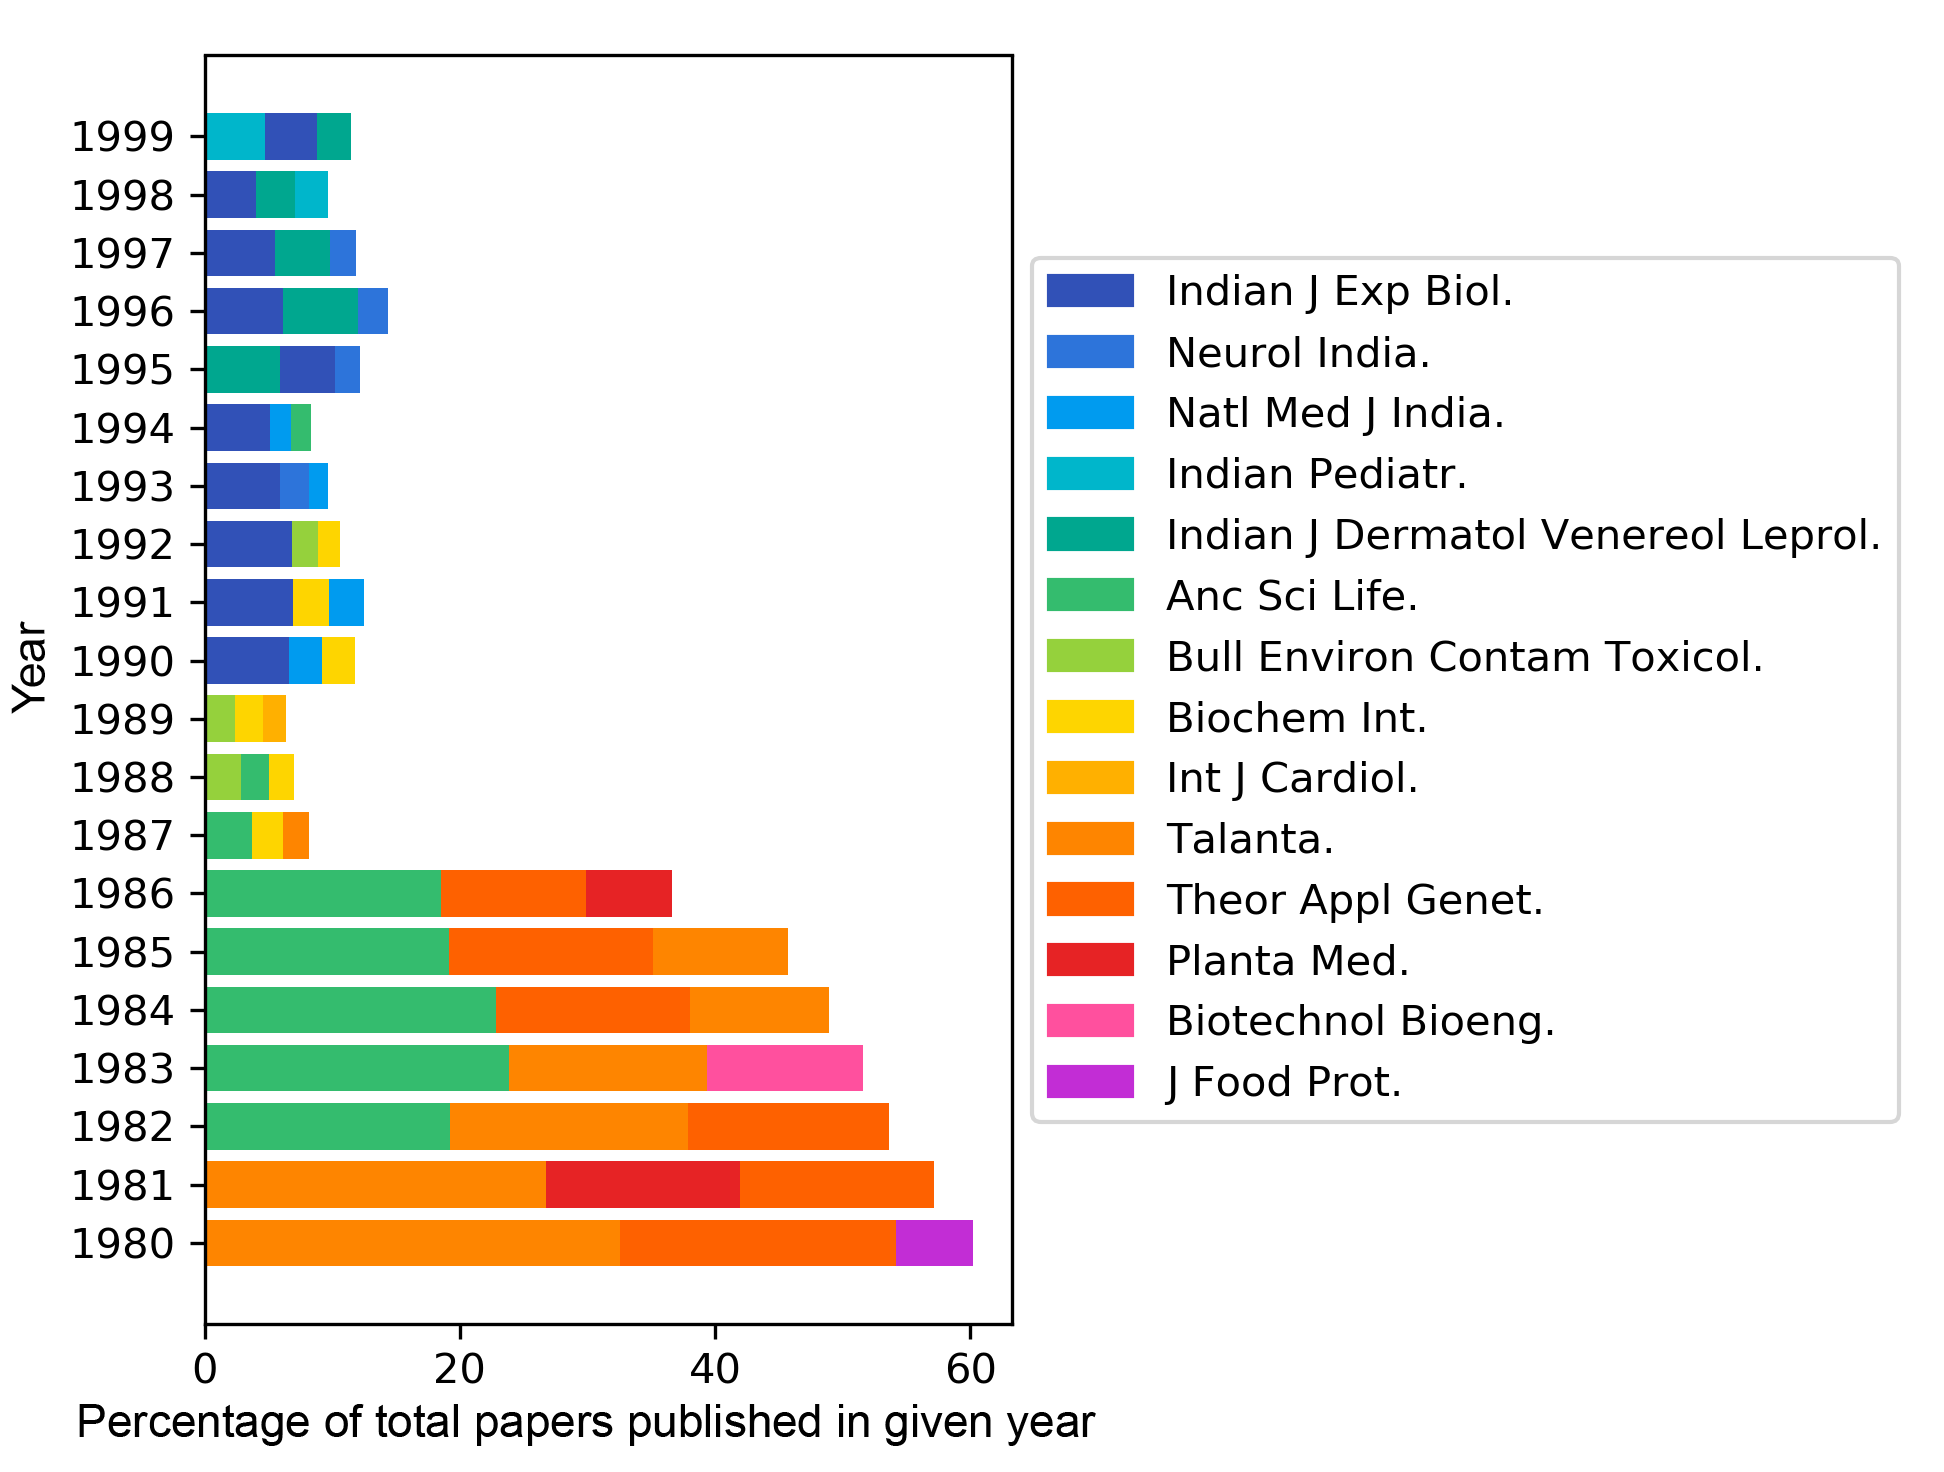
| Fig 4: Top 3 journals where Indian researchers published the most in given year (1980-1999). |
Fig 3 and 4 shows interesting trends of publications. During the 1980s almost 60% of the papers were published in journals. One of the reasons for such a high percentage might be a lower number of total papers (total 83 in 1980). This percentage, however, has come down to less than 10% in 2018. However, this is still huge by considering a number of journals available. Sadly, I could not get data regarding statistics on the area of research.
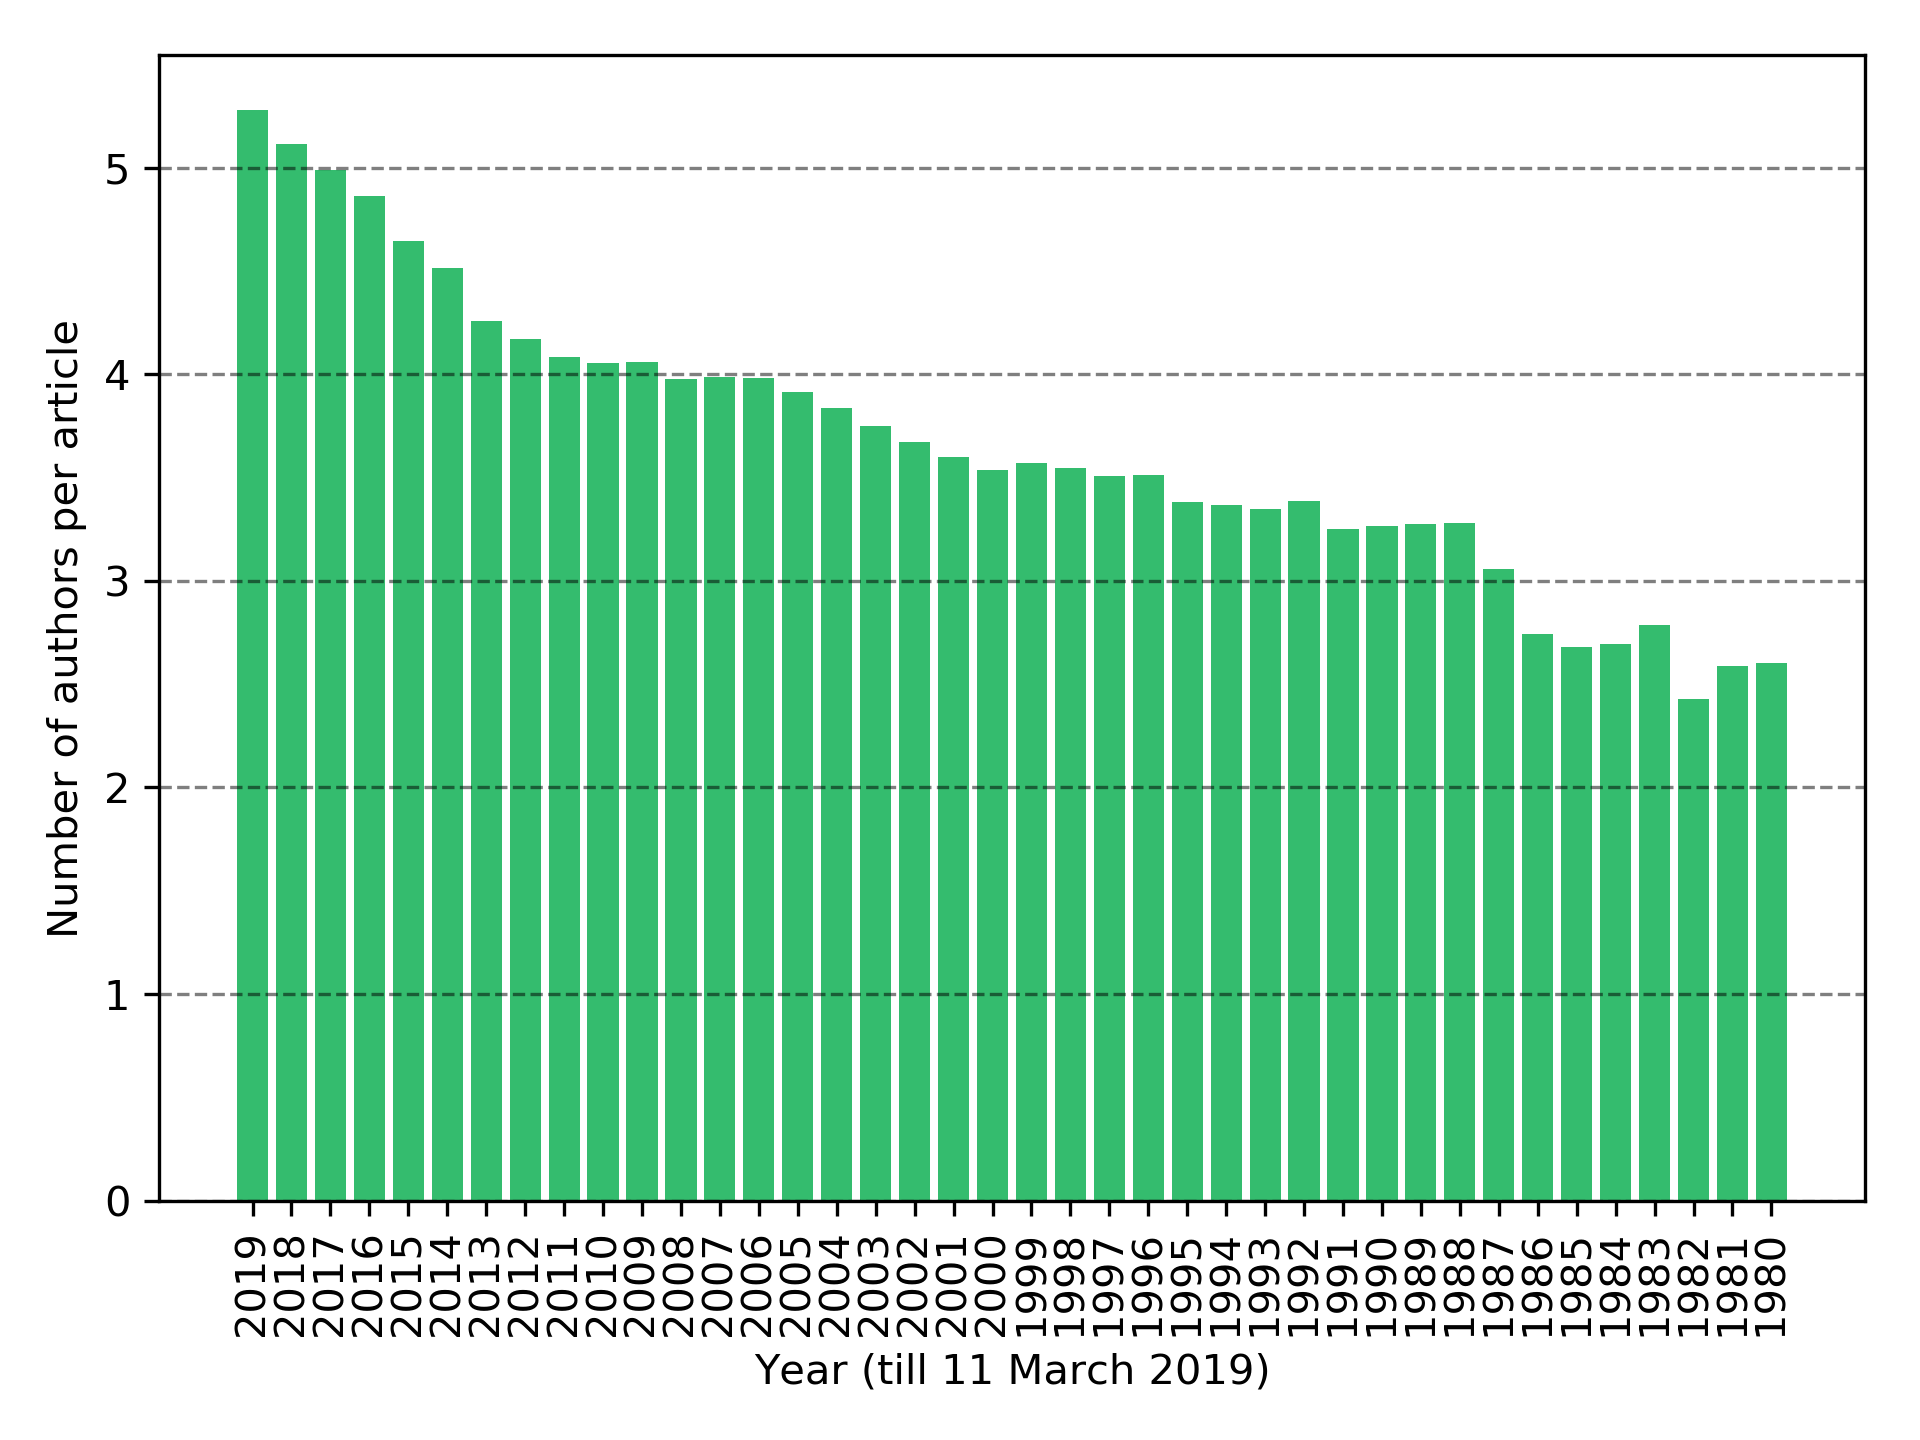
One more aspect which will impact scientific progress is collaborations. Best way to look at it is to have data on all of the author affiliations and then check how much inter and intra-country collaboration is there. Unfortunately, this dataset does not provide information about all of the affiliations. So I checked this aspect by looking at next crudest thing, i.e. number of co-authors. There were total 1835722 authors in our datasets which suggested 4.35 authors per article. I checked how are authors per article changing over the period of time.
 |
|---|
| Fig 5: Authors per article over the period of time. |
As apparent from Fig 5, the number of authors per article is increasing for the last 30 years. This might be a sign of more collaborations.
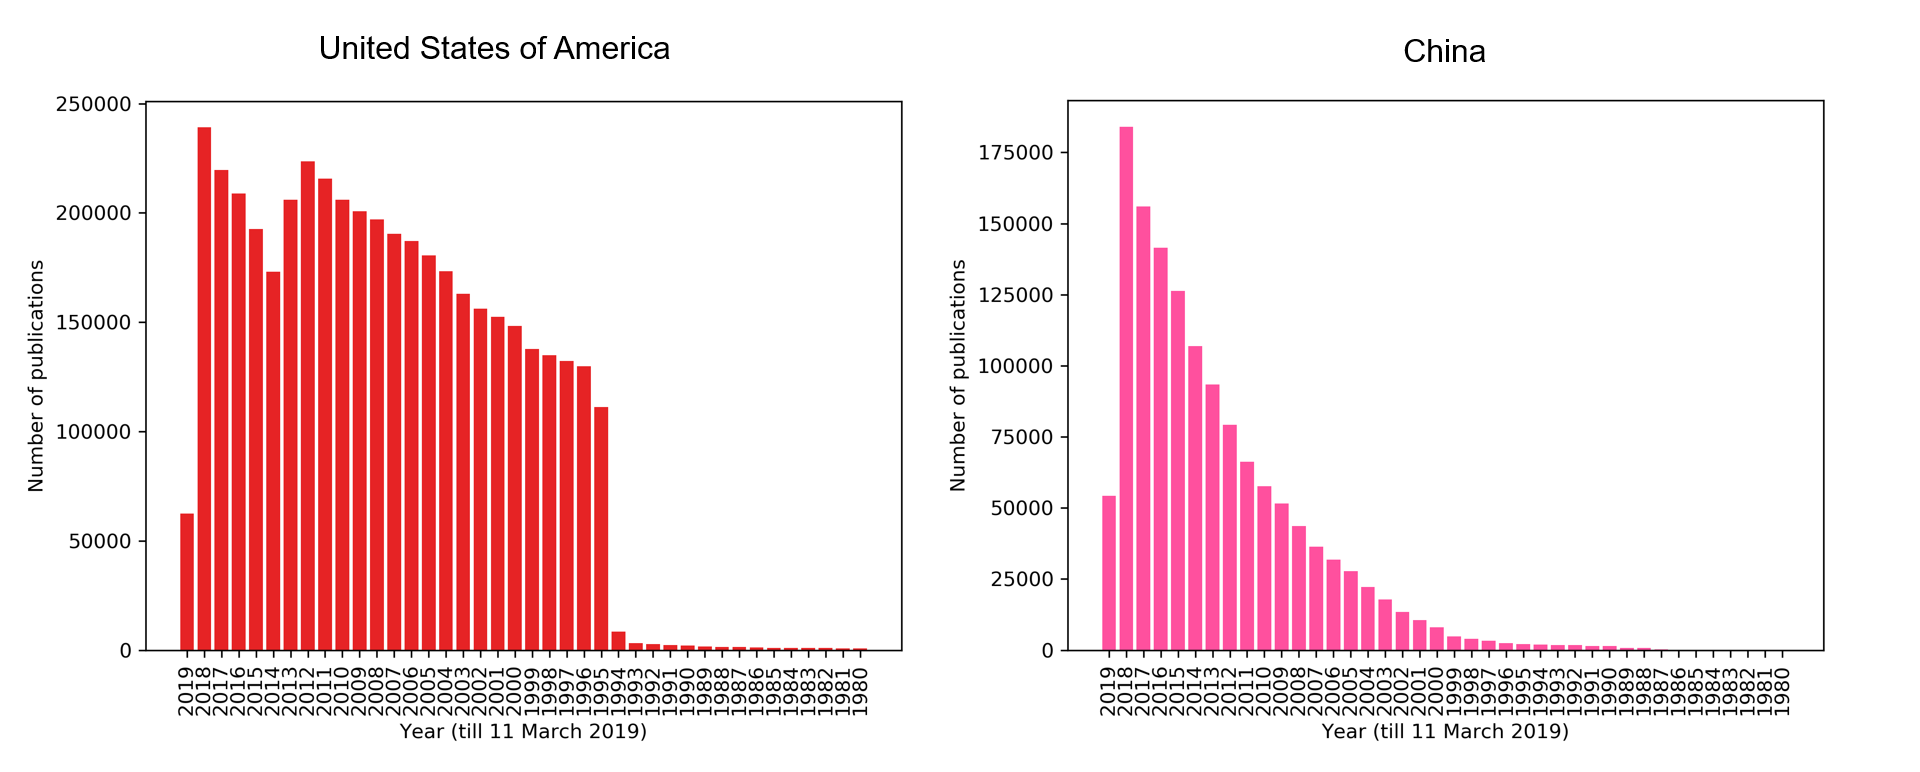
Next, I checked how do these statistics look in front of other countries. I took the example of China and the USA which are one of the top countries with the most number of academic publications 9. In my dataset, I got more paper in the USA than China which was contradictory to the data shown in [9]. This might be the outcome of our way of accessing data. This dataset will also include all the papers which have an author with USA affiliation. This may suggest more collaborations of USA.
 |
|---|
| Fig 6: Number of papers published by researchers from US and China over the years. |
 |
|---|
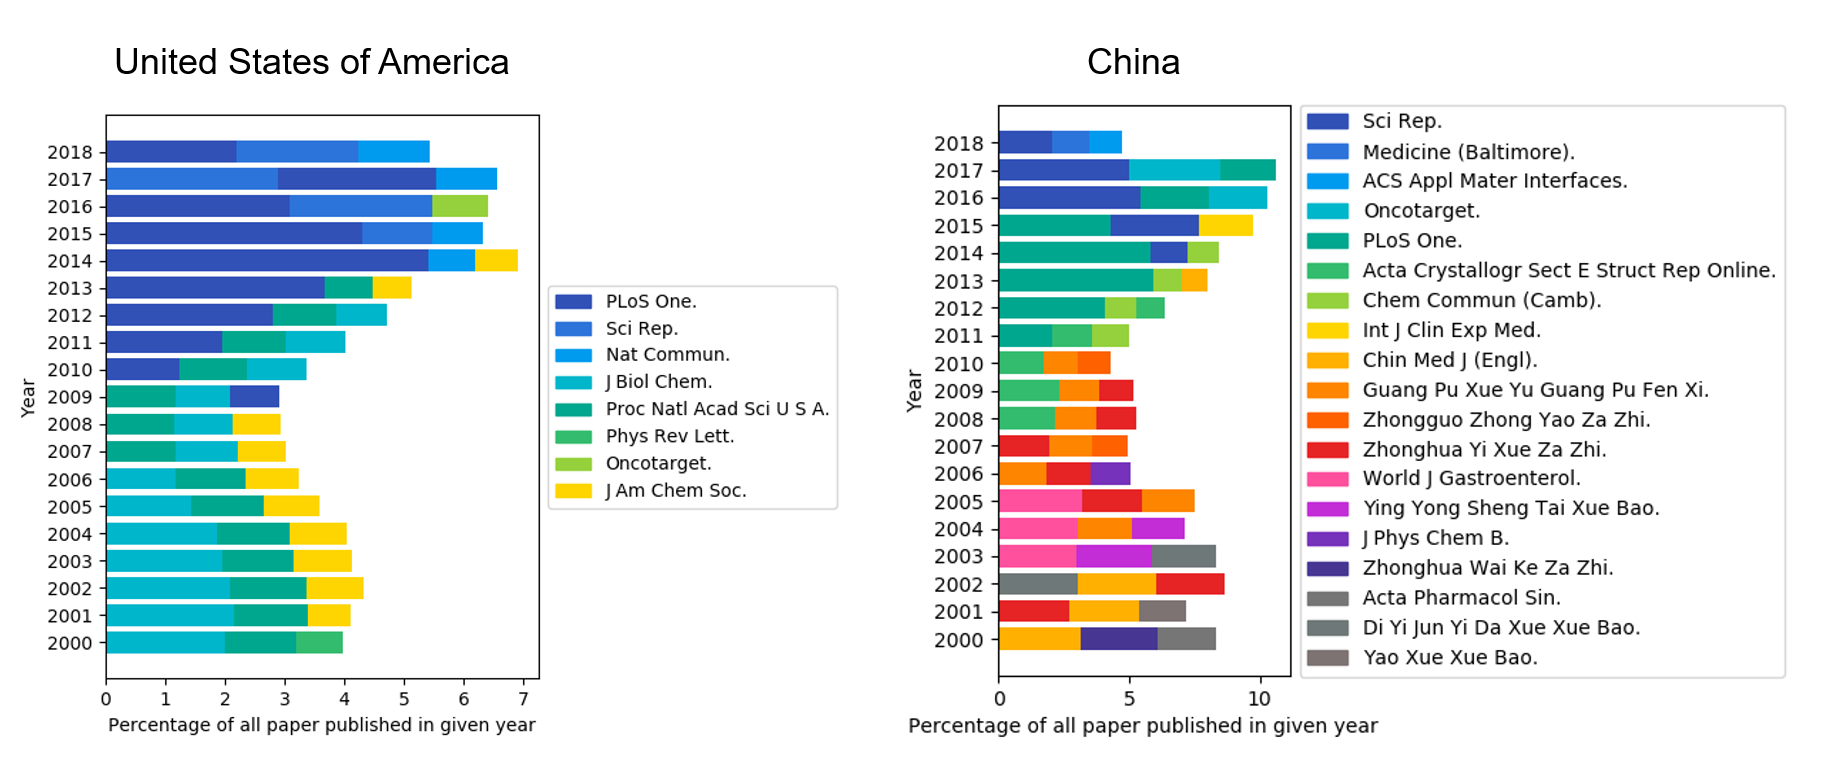
| Fig 7: Top 3 journals where US and China researchers published the most in given year. |
Overall statistics regarding top journals for US (total of 4379149 papers in 15489 distinct journals) and China (total of 1356651 papers in 8146 distinct journals) is given below
| USA (number of paper) | China (number of papers) |
|---|---|
| PLoS One. (59832) | PLoS One. (31863) |
| J Biol Chem. (47819) | Sci Rep. (26499) |
| Proc Natl Acad Sci USA. (39167) | Chem Commun (Camb). (11551) |
| J Am Chem Soc. (26193) | Chin Med J (Engl) (11133) |
In conclusion, this analysis provides a wider perspective on Indian science. Above table, Fig 6 and 7 suggest that publication trends of Indian researchers were similar to that of US and China. However, properly curated data should be able to provide us with a more clear picture.
Code used in the above analysis can be found here.
(Header image by felixioncool from Pixabay, released under CC0-license.)