

Published on 22 August 2018
random data analysis and visualization :)



This post is an outcome of short analysis I discussed in my previous post. While checking the distribution of trains across different railway stations, I came into a problem of differentiating regular long distance railways versus local and suburban trains. At that time I was not aware of any database which can separate these trains. Hence, I used distance as a crude criterion for that. After that, I was searching for if there exists such a database where we can differentiate between these two types of trains. While discussing with my other colleagues, one person mentioned that long-distance trains number always starts with a letter “1”. Initially, I thought it might be some regular observation, but then I started to see a little bit of pattern. Then simple google search gave me a link to the blog explaining the logic behind the Indian train number. It was mind-boggling. I quickly adapted this system to understand my current dataset. I am enlisting a few key points from that blog which separates local or suburban trains from others. If we look at the first digit of trains with 5 digit train numbers, we can identify them as follows.
| Digit | First Digit (type) | Second Digit (zone) |
| 0 | special trains | Konkan Railway |
| 1 | long-distance trains | CR, WCR and NCR |
| 2 | long-distance trains if 1 is exhausted | Superfasts and Shatabdi |
| 3 | Kolkata suburban | ER and ECR |
| 4 | suburban trains in Chennai, New Delhi, Secunderabad, and other | NR, NCR and NWR |
| 5 | passenger trains with conventional coaches | NER and NFR |
| 6 | MEMU trains | SR and SWR |
| 7 | DEMU and railcar services. | SCR and SWR |
| 8 | reserved | SER and ECoR |
| 9 | Mumbai locals | WR, NWR and WCR |
For example, Train number 15905 (Dbrg Vivek Express) will be long distance (1) and from NER or NFR zone (5). More detailed information about numbering can be found on IRFCA website. For the zonal part, fortunately, I have already scrapped data from existing database. Hence, I have a database of every station and which zone and state it belongs to. You can get this data from GitHib.
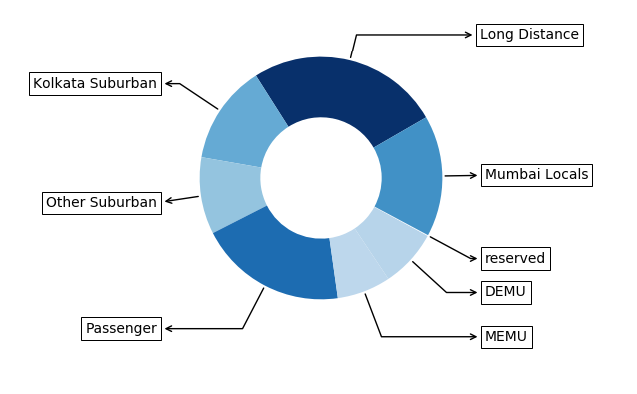
It looks like 5 train number system was adopted from 20 December 20101. Another interesting thing I found out is that Down refers to a train travelling away from its headquarters or from its Divisional headquarters, whichever is closer 1,2. I quickly looked into my database about statistics on old and new trains. Following are the statistics
 |
|---|
| Fig 1: Distribution of different types of trains named after 2010. Other suburban includes suburban and local trains from Chennai, New Delhi, Secunderabad and other. (Total trains:10840) |
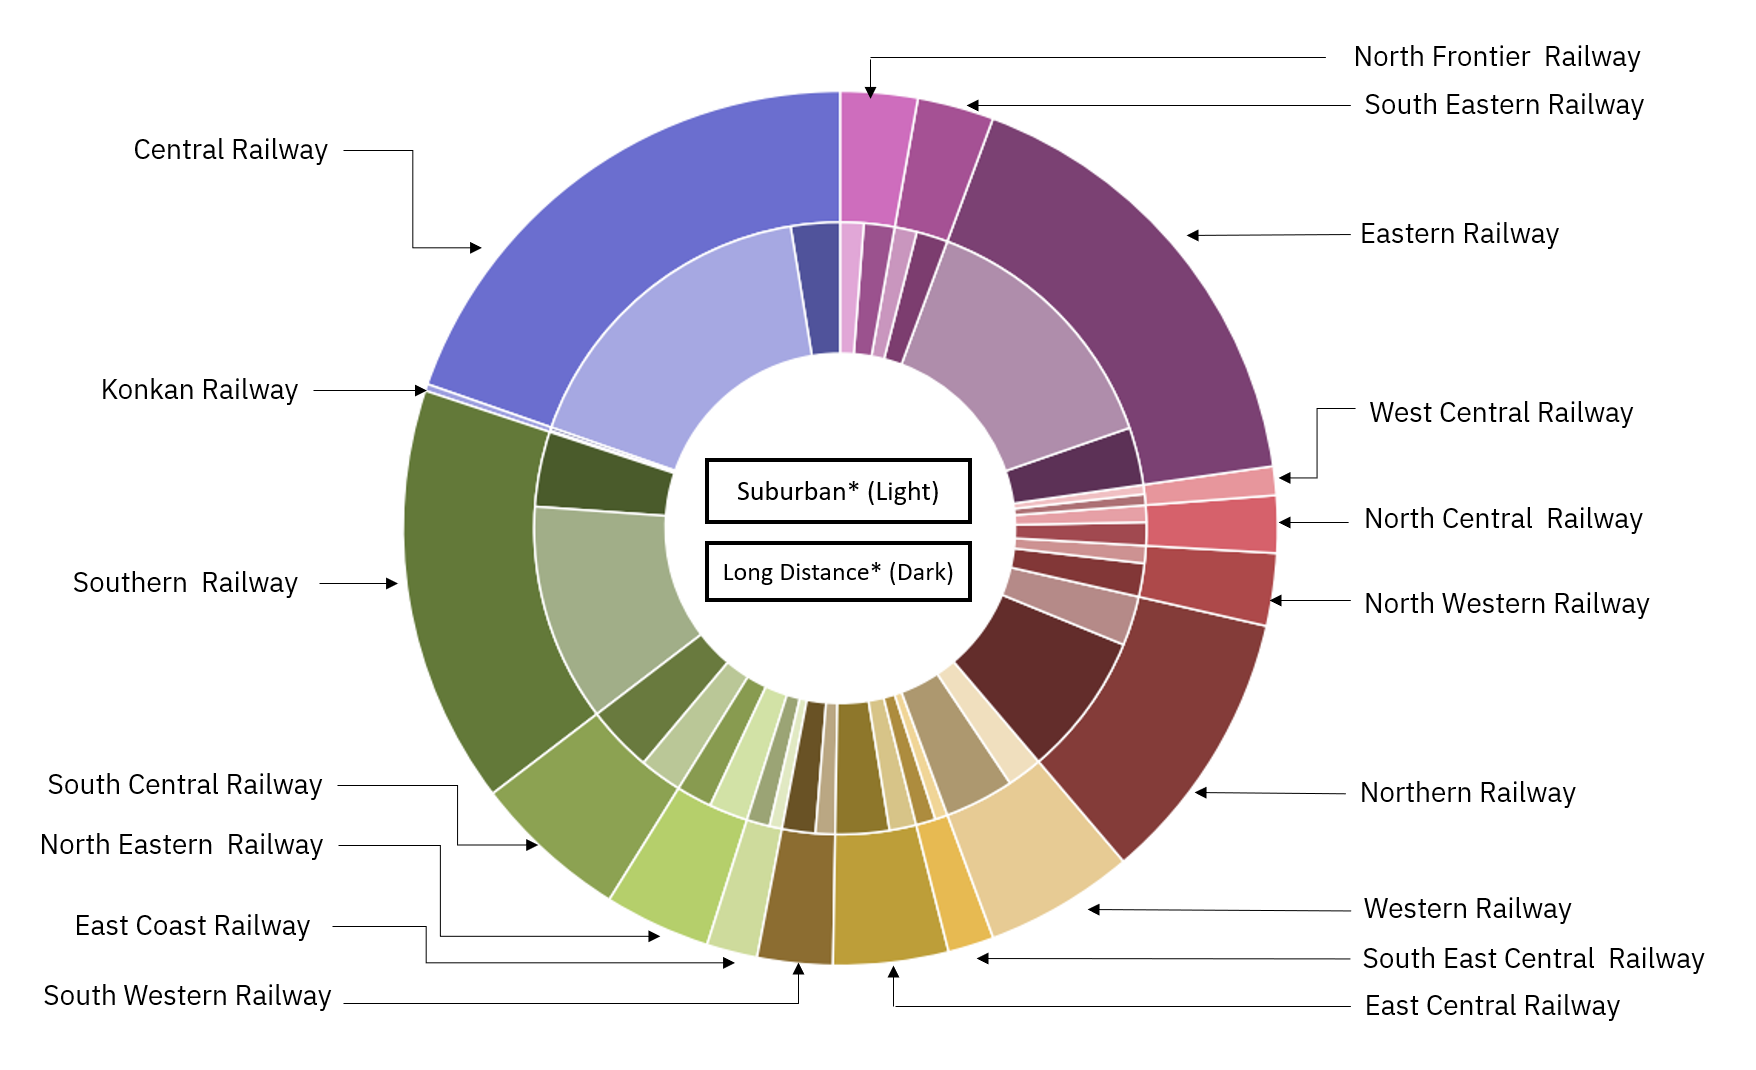
Next, I checked how this look into different zones. There are 16 zones3 in Indian Railway. In the data retrieved from the web, I also received zone named “KR” which was not there is official zones names. After searching which stations are included in that, I found out it was part of “Konkan Railways”.
 |
|---|
| Fig 2: Zone wise distribution of Indian trains. Outer Pie represents the zonal distribution of trains while inner pie further subdivides it into Suburban/local and long distance trains based on train numbers. Only 5 digit train numbers were included in this analysis. A darker shade of color represents long-distance trains while light color represents suburban trains. *Suburban trains also includes passengers while long-distance trains also include special, MEMU and DEMU. (Total trains:106974) |
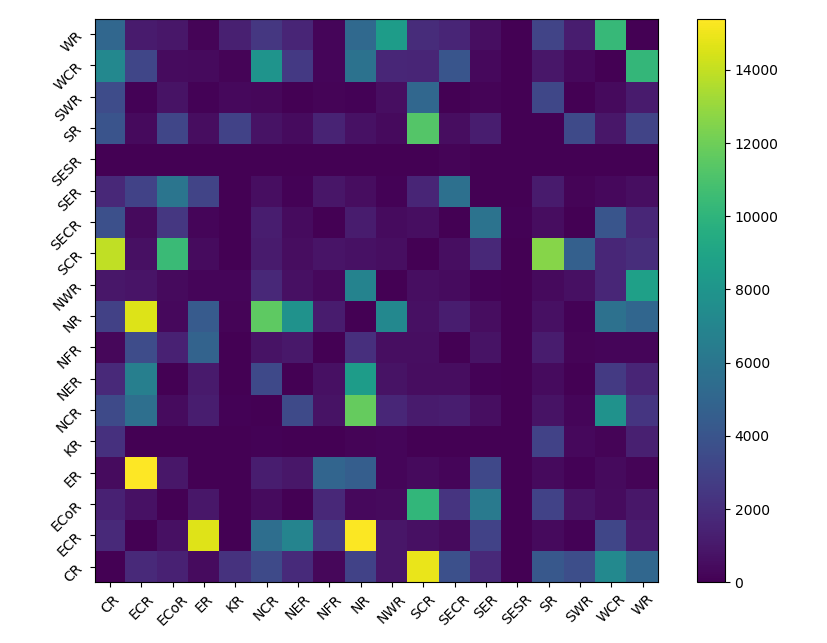
I was curious about how different zones are connected to each other. To understand that I scanned every railway and checked which zones it is connecting. In a single railway route, I considered all possible combinations of connectivity. For example if a train has route (A->B->C) then I will consider (A->B, A->C and B->C) as possible connections. Then I counted all combinations where routes connect two different zones. For this purpose, I constructed the matrix with all possible zone combinations. Every time we have a connection, we can increase the counter for given zone pair. If we plot this matrix as a histogram, we should be able to see inter-zonal connectivity.
 |
|---|
| Fig 3: Inter-Zonal connectivity. Each block represents number of station-pairs from all the trains which connects two zones. |
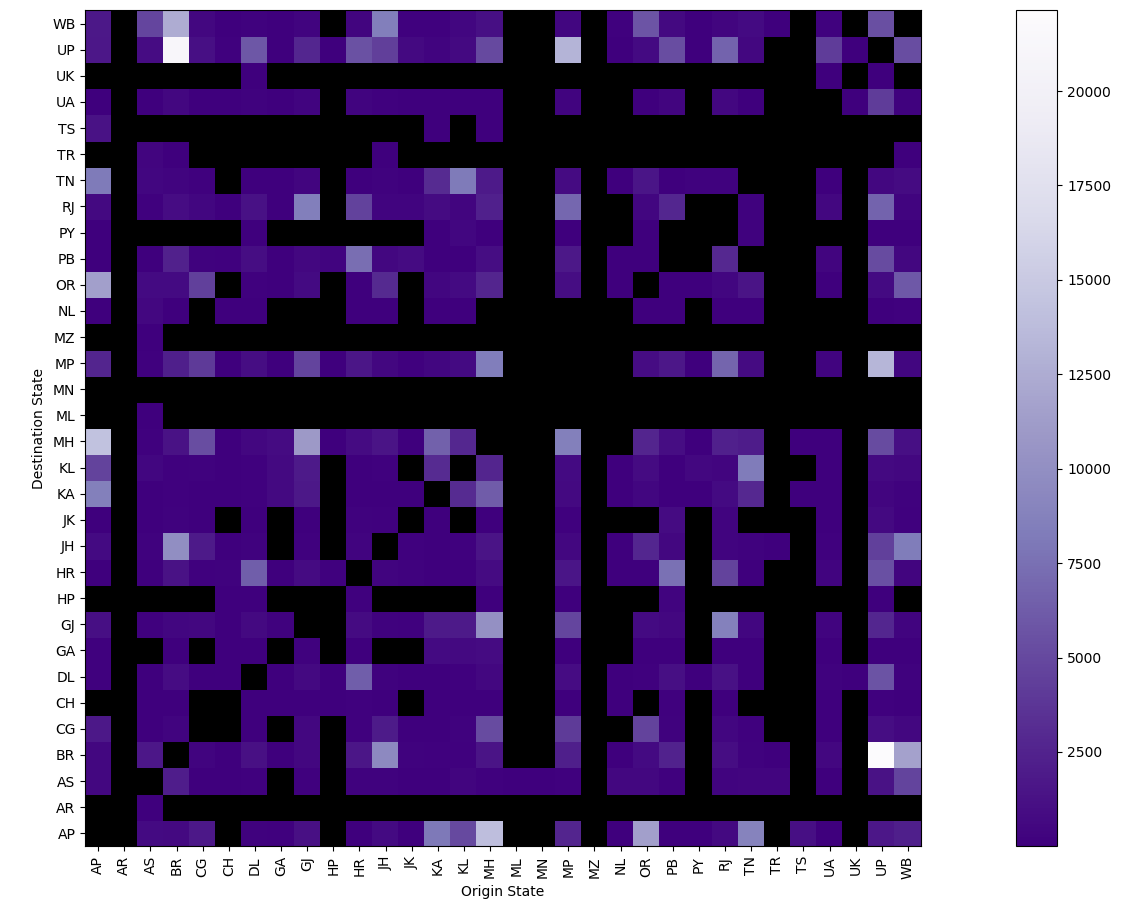
In Fig 3 we can see that there are few hot-spots of zonal inter-connectivity. Like ECR-ER, ECR-NR and CR-SCR. Obvious next step was to check if this translates to states which are part of these zones. This will not only validate our connectivity data but also tell us connectivity between states.
 |
|---|
| Fig 4: Inter-state connectivity. Each block represents number of station-pairs from all the trains which connects two states. Black color represents zero5. |
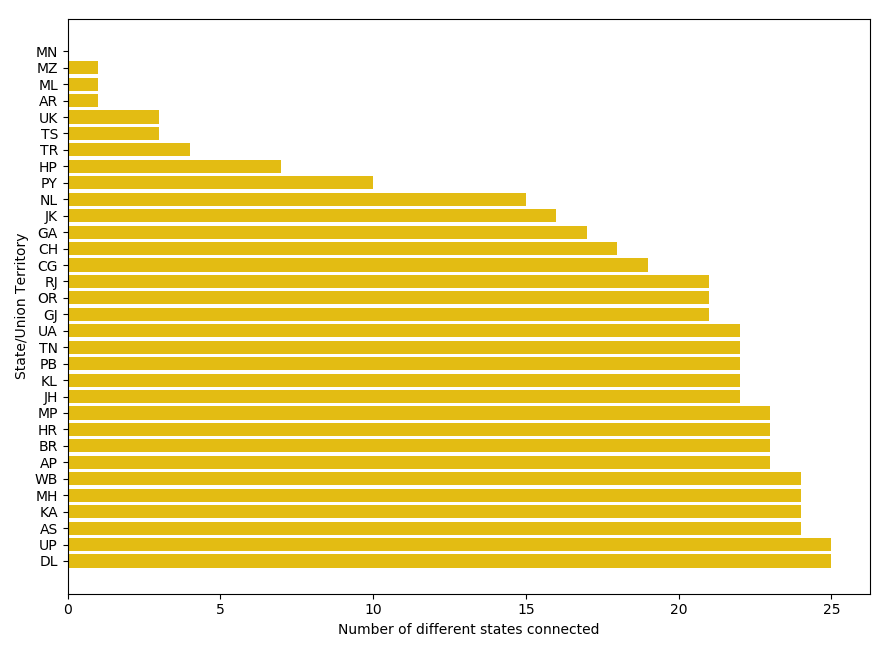
As seen in Fig 4, Uttar Pradesh was the top state which has connectivity with other states with approximately 87612 pairs of origin-destination stops. This was followed by Maharashtra (65908), Andhra Pradesh (60498) and Bihar (58434). However, this comparison might be biased as this number does not an account of a different number of states it is connected to. To resolved this, I just checked how many numbers of different states are connected.
 |
|---|
| Fig 5: Inter-state connectivity by distinct states. Two states are considered to be connected if there is at least one train which passes through them5. |
As Fig 5 shows, Delhi and Uttar Pradesh are most connected states who connects 25 out of 29 states and 7 union territories. Followed by Assam, Karnataka, Maharashtra and West Bengal (24 states/union territories). As a capital city, I was expecting to see Delhi on the top. Nonetheless, it is interesting to see how different parts of India are connected. In the next post, I will cover this geographical distribution in more detail.
Code used in the above analysis can be found here.
(Header image is downloaded from Pixabay.com under CC0-license)