In my previous post, I introduced readers to my new python library called SecretColors to get excellent colors to your python workflow. Essentially this library has collections of various different color palettes and very easy API to access them without searching for hex codes or RGB values. This blog post explains the basic concepts of this library along with examples. If you are here just for the comparison of this library with matplotlib, you can check out this blog post.
Table of content
- Background
- Basic Concepts
- Palette
- Colors
- Color Modes
- Shades
- Logical Normalization of shades
- Color Gradients
- Random Colors
- Matplotlib Integration
- ColorMap
- Utilities
Background
Before I explain the basic concepts behind this library, it is important to know why I created this library. Color is very important in data science. There are plenty of courses and blog posts which highlights the importance of colors in data visualization. Importance of it is out of the scope of this post. In my design process, I spend a significant amount of time selecting an appropriate color palette which can convey correct emotions of the artwork. Similarly, I spend good time on selecting proper color when I am using data visualization in conveying the information. Fortunately, from classic Playfair’s studies to modern publications, there is huge amount of research1, 2, 3 has done in color theory and how colors can influence the visualization. I started using concepts from such research into my visualizations. Quickly I realize, various institutions and companies have already generated “good” colors for various use-cases which are effective in conveying a message to the readers. Then I started to use those colors in my daily workflow. Every time I had to go to their website and copy-paste desired color hex value. Some of the software like Adobe Photoshop or Adobe Illustrator has the option to add those color palettes in your daily workflow. However, while creating visualizations with programming, I had to resort to copy-paste mechanism. This was time-consuming and frustrating, especially when I am trying out a various color for the specific plot. Hence I went looking for some library which can give me access to such data on the fly. As of 29 May 2019, there are 3645 libraries in python’s PyPi distribution which is related to “color”. I went through some of them but most of them were color manipulation or UI improvement libraries. Hence finally I decided to make this library to provide access to some popular color palettes. In addition, I added a few color manipulation tools to the library for flexibility.
Basic Concepts
To use this library easily, there are only a few basic concepts which you need to understand. They are super simple and perform as named. Once you know how to use them, your imagination is the limit!
When this library was created, I was using it only for matplotlib plotting. Many of the functions are optimized and user-friendly for matplotlib. However, you can use it in any of your workflows. It will shine anywhere you are dealing with colors :)
Palette
The basic unit of this library is the Palette class. It is essentially an object holding your color palette. This is the entrance of this library. You can create this object just like any other python object initialization,
from SecretColors.palette import Palette
p = Palette()  # This is your `Palette` object
Above code will generate object holding default color palette (IBM Color Palette). To initialize different color palette, you can simply put its name while initializing the palette,
ibm = Palette("ibm")  # IBM Color Palette
material = Palette("material")  # Google Material Design Color Palette
Currently this library supports following color palettes
This class is created flexible so that we can add unlimited color palettes in the future. If you are curious which all actual colors are used in this library, you can take a look at this file. However, the next section will explain it to you how easy it is to access all of those colors without memorizing them.
In future, I would like to add my own custom color palette as a default which should take best of all palettes and make something even better.
Colors
Obviously, the most important aspect of this library is color. This library supports many out of the box colors (psst… we don’t call ‘black’ color as ‘k’). You can use them directly as follows
p = Palette()
p.red()  # returns '#fb4b53'
p.green()  # returns '#24a148'
p.aqua()  # returns '#12a3b4'
Currently there are following colors available
| red |
blue |
green |
magenta |
| purple |
cyan |
teal |
gray_cool * |
| gray_neutral * |
gray * |
gray_warm * |
red_orange * |
| black * |
white * |
ultramarine # |
cerulean # |
| aqua # |
lime # |
yellow |
gold # |
| orange |
peach |
violet |
indigo |
| pink |
purple_deep # |
blue_light # |
green_light # |
| orange_deep # |
brown |
gray_blue * |
|
* These will be categorized as gray_shades
# These will be categorized as extra
These color names are essentially from various color palettes used in this library. Even though some of the colors are not available in other palettes, this library will handle it automatically. It will pick a color from the next available color palette. For example, let’s say you are using “IBM” palette and used color green_light, the library will use green_light color from “Google Material” color palette as no such color is available in “IBM” color palette. Hence, you don’t have to worry about memorizing which colors are in which color palette.
gray_shade colors will be omitted from color palette if you use allow_gray_shades = False option while initializing your color palette. This will affect when you are selecting random colors or iterating colors from the class iterator. You can always access them by calling them directly. For now, there is no special treatment for extra colors. These are tagged for future functionalities. Notice the spelling of ‘gray’, I used American English for ‘color’ spellings.
Color Modes
Another very easy and handy function available in this library is color mode. You can easily convert or output colors in a variety of color formats. You can specify color_mode option either during palette object initialization or any time during object lifetime to control the color output format. Currently, this library supports following color modes,
- hex - Hex Format [Default]
- rgb - RGB Format (values between 0 to 1)
- rgb255 - RGB Format (values between 0 to 255)
- hsl - HSL Format (values between 0 to 1)
- rgba - RGB with Alpha/Transparency (values between 0 to 1)
- ahex - Hex with Alpha/Transparency (Appended before hex)
- hexa - Hex with Alpha/Transparency (Appended after hex)
- hsla - HSL with Alpha/Transparency (values between 0 to 1)
For example,
p1 = Palette() # Default Color mode (hex)
p1.green() # '#24a148'

p2 = Palette(color_mode="hexa")
p2.green() # '#24a148ff'

p3 = Palette(color_mode="ahex")
p3.green() # '#ff24a148'

p4 = Palette(color_mode="rgb")
p4.green() # (0.141, 0.631, 0.282)

p5 = Palette(color_mode="rgba")
p5.green() # '(0.141, 0.282, 0.631, 1)'
p5.color_mode = "hex"
p5.green() # '#24a148'
SecretColors.utils have a variety of converters (will discuss later on) which can be used to convert your own colors.
Matplotlib can accepts “hex”, “rgb” or “hexa”
The way color mode works is that it always deals with hex internally. And at the time of output, it converts hex into the desired output. Also keep in mind that while converting it into other formats, due to round off error, converting back might not give exact same color. This issue is discussed in Utils section. For general purpose use, this issue won’t be any problem.
You can get color with transparency by defining alpha parameter while initializing color. However, this will have an impact on color only if the color mode is compatible with transparency.
p1 = Palette()
p1.red(alpha=0.5)  # Returns #fb4b53 and alpha will not have any effect on the color
# as default color mode is hex which does not support transparency
p2 = Palette(color_mode="hexa")
p2.red(alpha=0.5)  # Returns #fb4b537f
Shades
Another important and little bit complex concept about this library is shade. This is essentially shade of given color from lighter to darker. If you look at all the color palettes provided in this library, each palette has different shades of the same color, from lighter to darker. Each of these shades is defined by some quantitative number. For example, in IBM palette, these shades are defined from 5 to 100 while in Google Material Color Palette, these shades are defined from 50 to 900. In contrast, some like ColorBrewer do not have any quantification associated with their colors. For the sake of uniformity and flexibility, I normalized each shade between 0 to 100, where the lightest shade will be defined by 0 and darkest shade will be defined by 100. If such shade is not available in a given palette, white and black are used respectively. I have done ‘logical normalization’ (Fig 1) which will be intuitive to convert original values to normalized one (explained in the next subsection).
shade should be always between 0 to 100.
For example,
p = Palette()
p.blue()  # Returns '#408bfc'
p.blue(shade=20)  # Returns '#c9deff'
p.blue(shade=90)  # Returns '#061f80'
When no shade value is given, it uses default value set for given palette or 50 (whichever is available).
Logical Normalization of shades
As multiple color palettes have their own shades of colors, it was important to have some mechanism which can provide some uniform shades of colors. For this purpose, I created something called ‘Logical Normalization’. It is nothing but scaling original shade values to 0 - 100. In addition, it was also important to maintain easy access to the original shade. I decided to normalize it with the following formula,
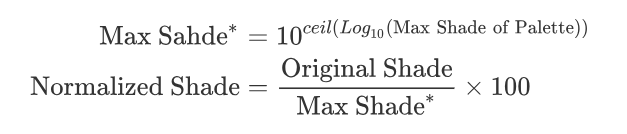
In addition to above normalization, we will add white (#FFFFFF) and black (#000000) for 0 and 100 respectively, if shades with values 0 and/or 100 are not available after normalization. Take look at Fig 1 for example of logical normalization of the palette shades.
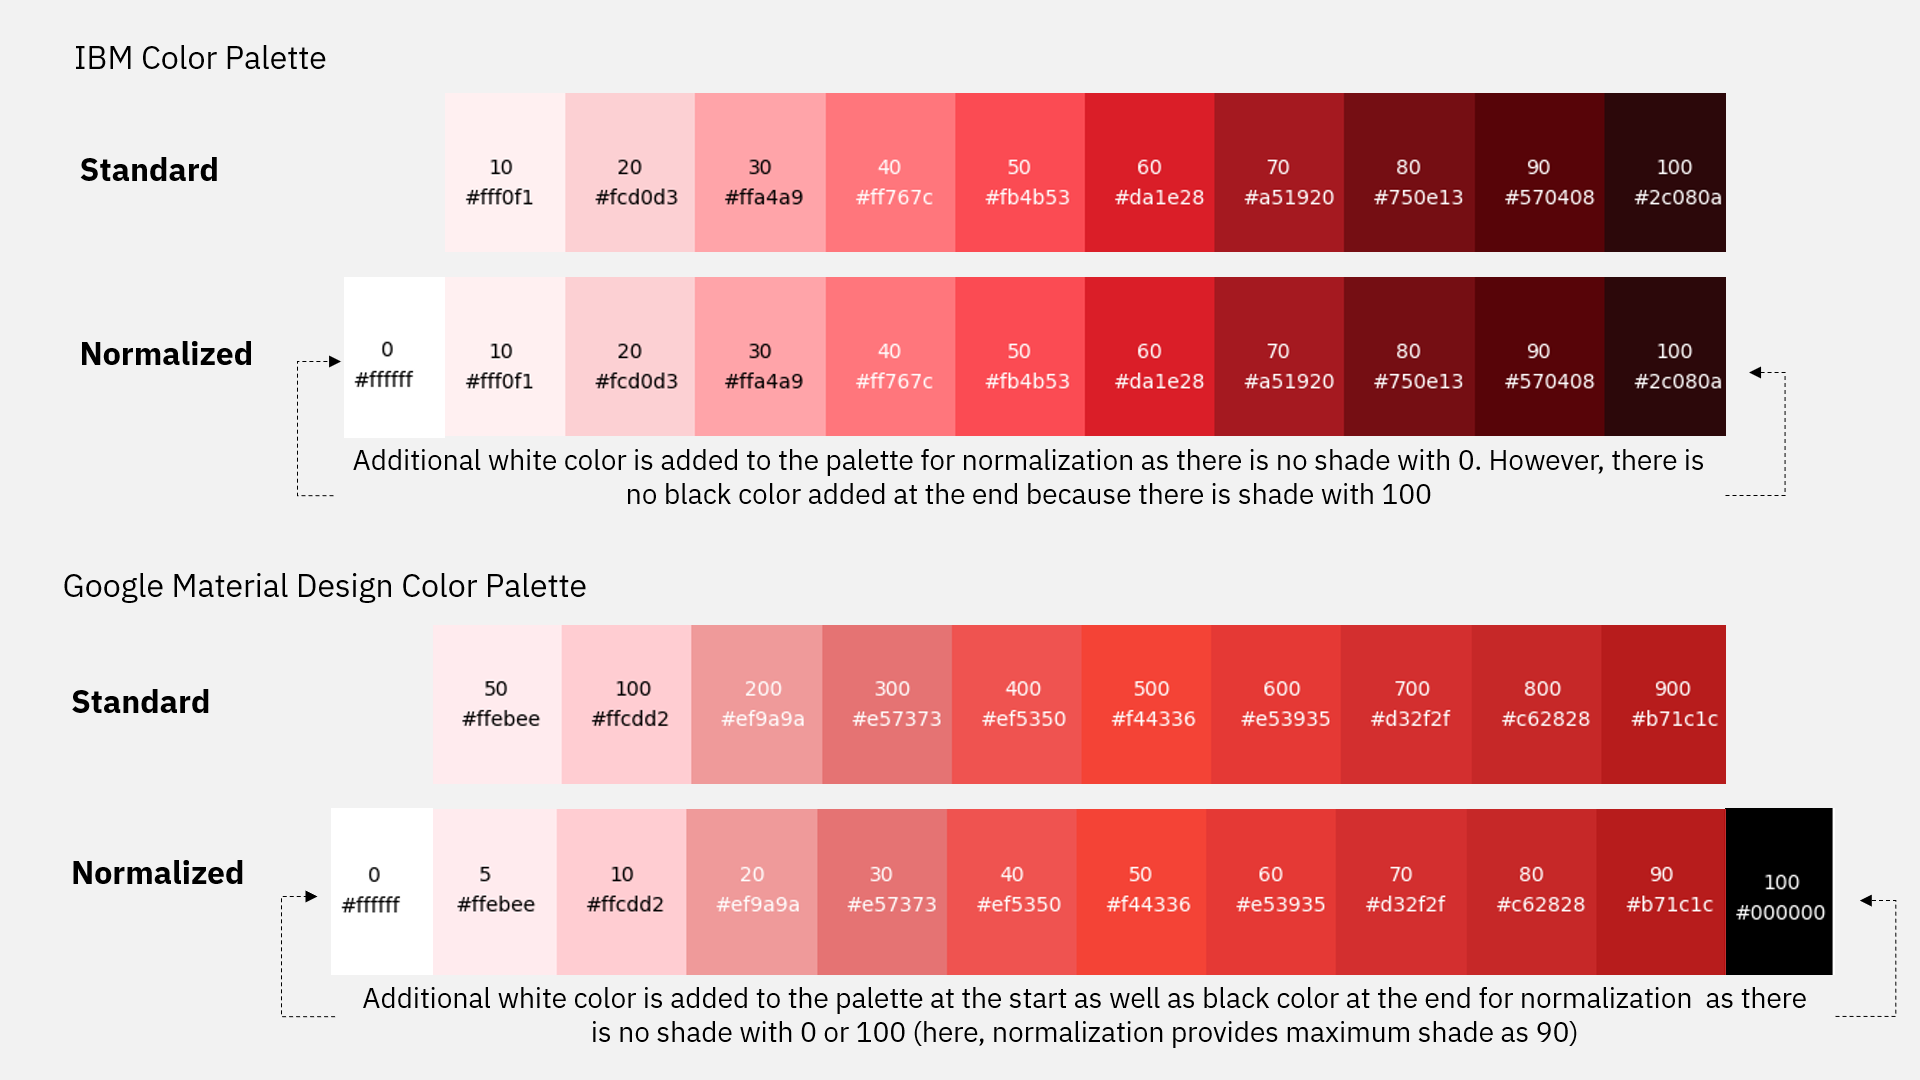 |
| Fig 1: Logical Normalization of color palettes |
Entire algorithm and logical steps for accessing specific shade is explained in the Fig 2.
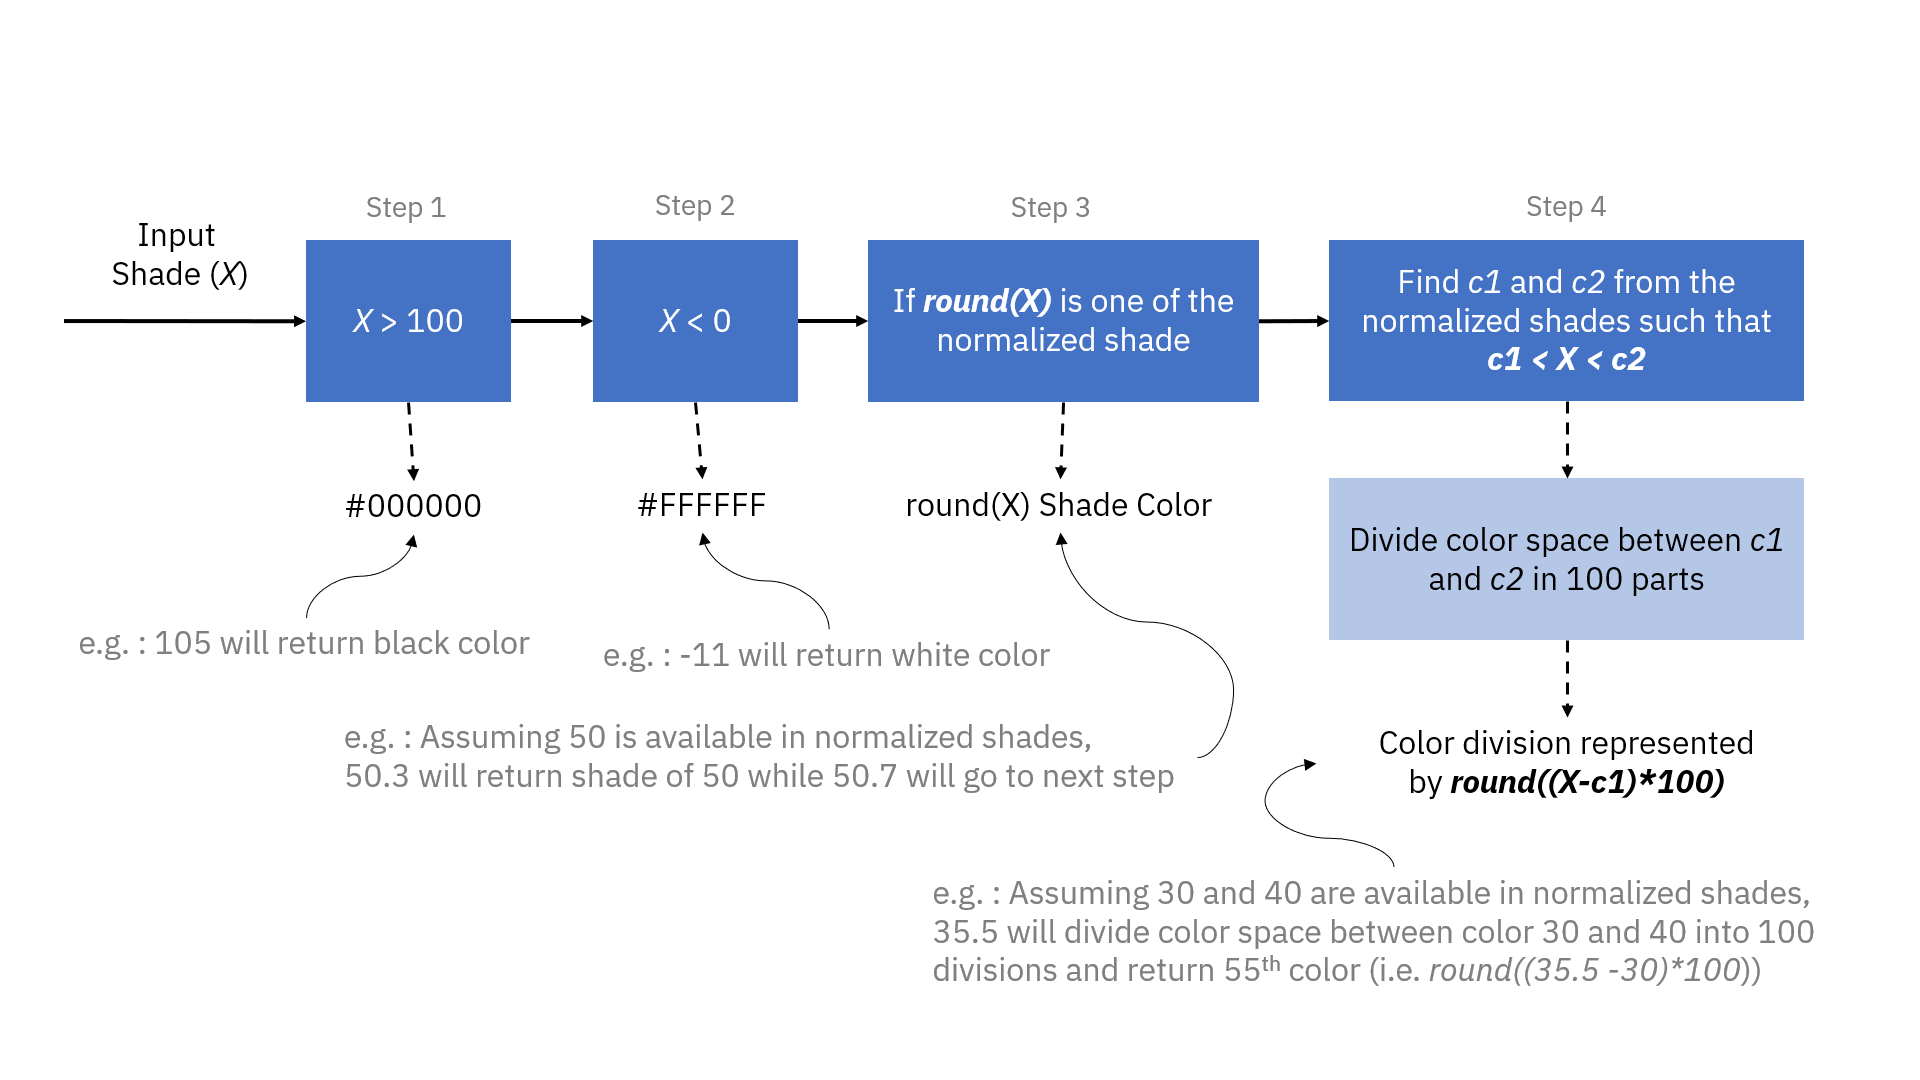 |
| Fig 2: Logic of generation of color shades from the palette |
As seen in Fig 2, we can fine-tune the color shades as per our convenience. Full can be found in this file. Currently, by default, I am dividing color space between two colors in 100 divisions, however, in future, I plan to add more fine tune options. For now, work around this limitation is to use color_in_between() function from SecreColors.utils
Color Gradients
It is very easy to make color gradients with this library. If you want a single color gradient, you can directly pass no_of_colors argument while generating color
p.red(no_of_colors=5)  # ['#fcdadc', '#ff949a', '#fb4b53', '#b61a22', '#6b0a0f']
p.red(no_of_colors=3, starting_shade=30)  # ['#fb555d', '#bf1b23', '#6d0b10']
p.red(no_of_colors=3, ending_shade=50)  # ['#fee7e9', '#fdbabd', '#ff8187']
You can use flexible color_between() function of palette to generate color gradient between two colors
p.color_between(p.aqua(), p.teal(), no_of_colors=3)  # 3 colors between aqua and teal
p.color_between(p.aqua(), p.teal(), no_of_colors=5, include_both=True)
# Both aqua and teal will be added to final return list
Note: color input should be in hex format
Random Colors
Another fun and useful utility is to get random colors in various different ways.
p.random()  # Random Color
p.random(shade=40)  # Random color with shade 40
p.random(no_of_colors=5)  # 5 random colors
p.random(no_of_colors=10, starting_shade=30, ending_shade=60)  # 10 random colors
# who's minimum shade can be 30 and maximum shade can be 60
If you want to know which color is used while randomizing (because sometimes results are surprisingly good :D ), you can passprint_colors parameter.
p.random(print_colors=True)
Want gradient between two random colors? No problem, we got you covered.
p.random_gradient(no_of_colors=5)
Matplotlib Integration
The initial purpose of this library was to use it in python’s iconic matplotlib library. As a result, a lot of functions in this library are optimized for matplotlib. The simplest way to use this library in matplotlib workflow is to use Palette instance in the color field.
import matplotlib.pylab as plt
from SecretColors.palette import Palette

p = Palette()
plt.bar(0, 1, color=p.red())
plt.bar(1, 2, color=p.blue())
plt.show()
You can use random() function to get different surprising colors every time you run the program.
import numpy as np
ind = range(5)
data = np.random.random(5)
plt.barh(ind, data, color=p.random(no_of_colors=5, shade=50))
plt.show()
Comparison between colors from default color scheme and SecretColor color scheme is done in another blog post.
ColorMap
The most useful function which can be used with matplotlib is ColorMap object. As of the current version, this part is still under heavy development. However, current limited functionality is still very flexible and handy. ColorMap object can generate custom colormaps which can be used directly in matplotlib workflow.
import matplotlib.pylab as plt
import matplotlib
import numpy as np
from SecretColors.palette import Palette, ColorMap

colorMap = ColorMap(matplotlib, Palette())
data = np.random.rand(10, 10)
plt.imshow(data, cmap =colorMap.greens())
plt.show()
Currently, only 4 default colormaps are supported (greens, hot, warm, calm). However, they are not optimized yet. We recommend customizing your own colormaps until further development in this object.
import matplotlib
import matplotlib.pylab as plt
import numpy as np
from SecretColors.palette import Palette, ColorMap

p = Palette()
colorMap = ColorMap(matplotlib, p)
data = np.random.rand(10, 10)
colors = [p.indigo(shade=70), p.indigo(shade=20), p.amber(shade=70)]
plt.imshow(data, cmap=colorMap.from_list(colors))
plt.colorbar()
plt.show()
This essentially opens unlimited options to generate colormaps. You can also use qualitative colormaps by passing is_qualitative=True argument.
plt.imshow(data, cmap=colorMap.from_list(colors, is_qualitative=True))
Utilities
There are tons of utilities which you can use as a standalone function. Few of useful functions and their uses are briefly described below. Check out full documentation for all utilities.
These can be imported as
from SecretColors.utils import *
Most important function in the utility class is color_in_between . Palette class uses this function to get arbitrary shades between two colors.
color_in_between("#24a148", "#12a3b4", no_of_colors=5)
Palette’s color_between is just a fancier version of above function.
If you want to get complementary colors
get_complementary("#24a148")
text_color is a very helpful function in deciding the text color of your plots. Generally, we should use black (or darker) text color on a lighter background and vice versa. This utility returns black or white color based on the brightness of the color. This is very essential in UI-UX point of view and readability of the graph or design.
text_color("#ffffff")  # Returns #000000
text_color("12a3b4")  # Returns #ffffff
Few useful converter functions
| Function |
Usage |
| rgb_to_hex |
Converts RGB to Hex
e.g. rgb_to_hex(0.98, 0.29, 0.32) |
| hex_to_rgb |
Converts Hex to RGB (0-1 range)
e.g. hex_to_rgb(“#f94951”) |
| hex_to_rgb255 |
Converts Hex to RGB (0-255 range)
e.g. hex_to_rgb255(“#24a148”) |
| rgb_to_hsl |
Converts RGB to HSL
e.g. rgb_to_hsl(0.34, 0.46, 0.22) |
| hsl_to_rgb |
Converts HSL to RGB
e.g. hsl_to_rgb(0.54, 0.66, 0.12) |
| hex_to_hsl |
Converts Hex to HSL
e.g. hex_to_hsl(“#f94951”) |
| hsl_to_hex |
Converts HSL to Hex
e.g. hsl_to_rgb(0.54, 0.66, 0.12) |
| hex_to_ahex |
Adds Transparency unit to hex code (at the beginning)
e.g. hex_to_ahex(“#f94951”, 0.8) |
| hex_to_hex_a |
Adds Transparency unit to hex code (at the end)
e.g. hex_to_ahex(“#f94951”, 0.8) |
| hex_to_rgba |
Converts Hex to RGBA
e.g. hex_to_rgba(“#f94951”, 0.8) |
| hex_to_hsla |
Converts Hex to HSLA
e.g. hex_to_hsla(“#f94951”, 0.8) |
Above conversion, functions are rounded off to 3 decimal points. Hence there might be a minor difference in color value when you convert it back. For example,
hex_to_rgb("#12a3b4") # Returns (0.071, 0.639, 0.706)
rgb_to_hex(0.071, 0.639, 0.706) # Returns #12a2b4
The above result changed slightly because while converting HEX to RGB, we rounded off our decimal points to 3 digits. This can lead to a loss of approx. 0.01 value from any of the Red, Green or Blue value. This will lead to a change in HEX value while converting it back. Visually, this will make very subtle and probably unnoticeable change in the color (see Fig 3). Hence, it is safe to use in your visualizations. However, we recommend not to use it in your algorithmic or logical functions for comparing absolute values. To resolve this, I am planning to add the ability to decide the round off digits in the function.
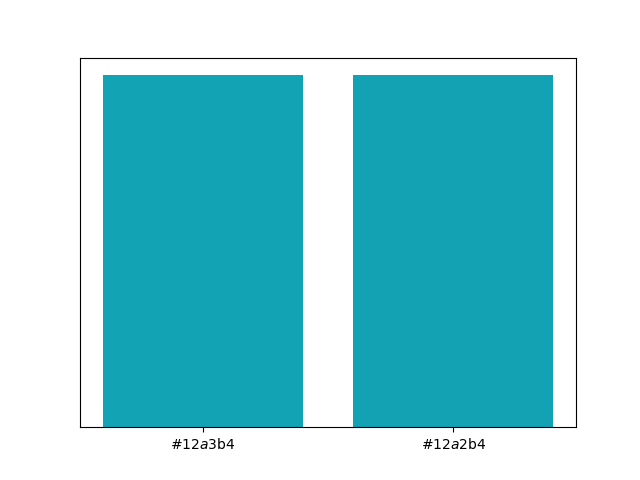 |
| Fig 3: Two closely related hex codes are used to generate above bars. There is difference of approx. 0.01 value in Green channel. However, this difference is visually, unnoticeable. |
References and Notes
- Tufte E. (1986). The Visual Display of Quantitative Information. Graphics Press, Cheshire, CT, USA. ISBN:0-9613921-0-X
- Osborne R. (1989), Color Theory and Its Application in Art and Design, by George A. Agoston, Springer‐Verlag, New York and Berlin 1987, 286 pp. 139 figs., paperbound. Color Res. Appl., 14: 272-272.
- Levkowitz H. (1997). Color Theory and Modeling for Computer Graphics, Visualization, and Multimedia Applications. Kluwer Academic Publishers, Norwell, MA, USA.
(Header image by pexels from Pixabay, released under CC0-license.)